

by the arrow in Fig. 5.22b). Magnified, the siderite-rich part was identified as firm
gray-colored concretions, as shown in Fig. 5.22c. The siderite concretion was
composed of an aggregate of small rod-like particles (Fig. 5.22d), as supported by
the Fe element map (Fig. 5.22e). EDX spectra (Fig. 5.22f, g) were obtained from the
dashed square areas identified in Fig. 5.22d. They show that Fe is the major element
other than C and O, which are also elemental components of siderite.
The powder XRD pattern of the siderite concretion (Fig. 5.22h) is similar to that
of reference siderite (Fig. 5.22i), although a small amount of quartz was also
detected. The SEM observation also showed platy clay particles around the siderite
(Togami et al. 2017), suggesting that the siderite nodules grew in the bulk soil.
Siderite in forms other than that shown in Fig. 5.22c, d were found in the same
soil horizon, where it appears that siderite is filling the pores of root iron plaque.
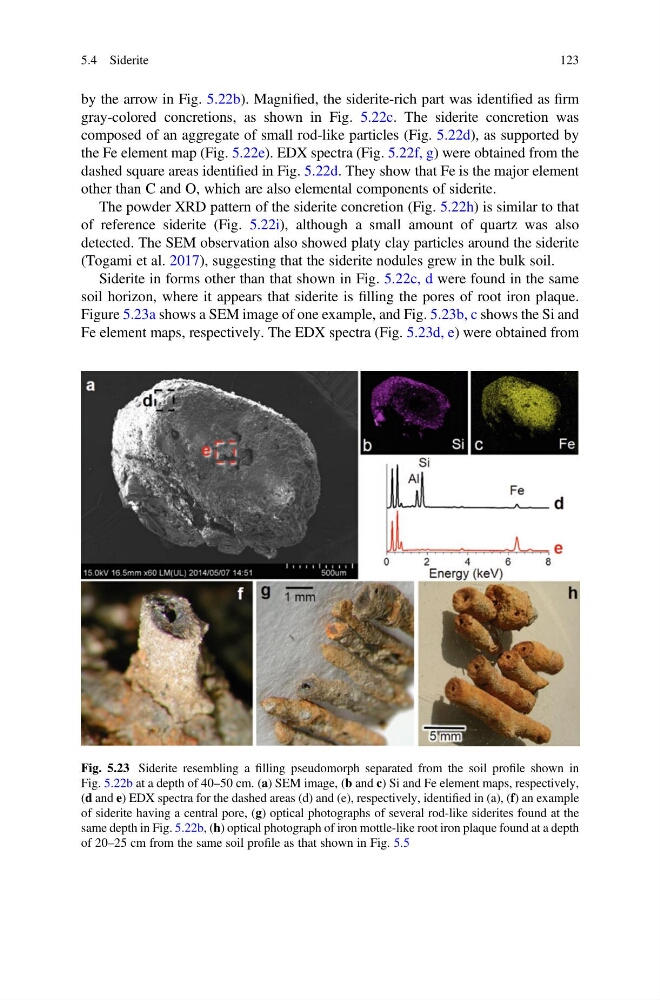
Figure 5.23a shows a SEM image of one example, and Fig. 5.23b, c shows the Si and
Fe element maps, respectively. The EDX spectra (Fig. 5.23d, e) were obtained from
Fig. 5.23 Siderite resembling a filling pseudomorph separated from the soil profile shown in
Fig. 5.22b at a depth of 40–50 cm. (a) SEM image, (b and c) Si and Fe element maps, respectively,
(d and e) EDX spectra for the dashed areas (d) and (e), respectively, identified in (a), (f) an example
of siderite having a central pore, (g) optical photographs of several rod-like siderites found at the
same depth in Fig. 5.22b, (h) optical photograph of iron mottle-like root iron plaque found at a depth
of 20–25 cm from the same soil profile as that shown in Fig. 5.5
5.4 Siderite
123
gray-colored concretions, as shown in Fig. 5.22c. The siderite concretion was
composed of an aggregate of small rod-like particles (Fig. 5.22d), as supported by
the Fe element map (Fig. 5.22e). EDX spectra (Fig. 5.22f, g) were obtained from the
dashed square areas identified in Fig. 5.22d. They show that Fe is the major element
other than C and O, which are also elemental components of siderite.
The powder XRD pattern of the siderite concretion (Fig. 5.22h) is similar to that
of reference siderite (Fig. 5.22i), although a small amount of quartz was also
detected. The SEM observation also showed platy clay particles around the siderite
(Togami et al. 2017), suggesting that the siderite nodules grew in the bulk soil.
Siderite in forms other than that shown in Fig. 5.22c, d were found in the same
soil horizon, where it appears that siderite is filling the pores of root iron plaque.
Figure 5.23a shows a SEM image of one example, and Fig. 5.23b, c shows the Si and
Fe element maps, respectively. The EDX spectra (Fig. 5.23d, e) were obtained from
Fig. 5.23 Siderite resembling a filling pseudomorph separated from the soil profile shown in
Fig. 5.22b at a depth of 40–50 cm. (a) SEM image, (b and c) Si and Fe element maps, respectively,
(d and e) EDX spectra for the dashed areas (d) and (e), respectively, identified in (a), (f) an example
of siderite having a central pore, (g) optical photographs of several rod-like siderites found at the
same depth in Fig. 5.22b, (h) optical photograph of iron mottle-like root iron plaque found at a depth
of 20–25 cm from the same soil profile as that shown in Fig. 5.5
5.4 Siderite
123