

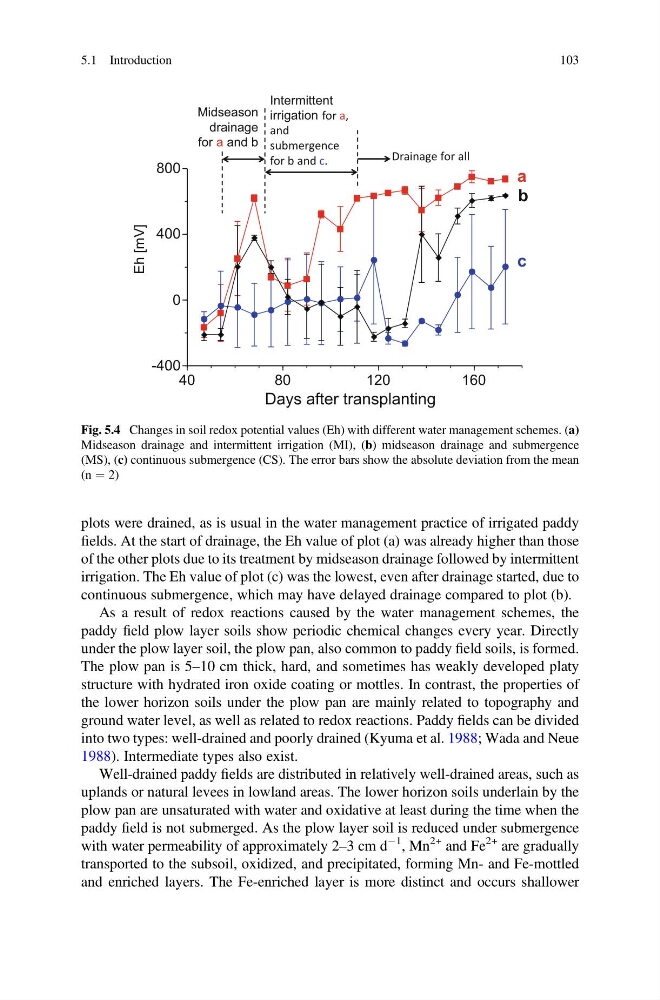
plots were drained, as is usual in the water management practice of irrigated paddy
fields. At the start of drainage, the Eh value of plot (a) was already higher than those
of the other plots due to its treatment by midseason drainage followed by intermittent
irrigation. The Eh value of plot (c) was the lowest, even after drainage started, due to
continuous submergence, which may have delayed drainage compared to plot (b).
As a result of redox reactions caused by the water management schemes, the
paddy field plow layer soils show periodic chemical changes every year. Directly
under the plow layer soil, the plow pan, also common to paddy field soils, is formed.
The plow pan is 5–10 cm thick, hard, and sometimes has weakly developed platy
structure with hydrated iron oxide coating or mottles. In contrast, the properties of
the lower horizon soils under the plow pan are mainly related to topography and
ground water level, as well as related to redox reactions. Paddy fields can be divided
into two types: well-drained and poorly drained (Kyuma et al. 1988; Wada and Neue
1988). Intermediate types also exist.
Well-drained paddy fields are distributed in relatively well-drained areas, such as
uplands or natural levees in lowland areas. The lower horizon soils underlain by the
plow pan are unsaturated with water and oxidative at least during the time when the
paddy field is not submerged. As the plow layer soil is reduced under submergence
with water permeability of approximately 2–3 cm d
À1 , Mn
2+ and Fe
2+ are gradually
transported to the subsoil, oxidized, and precipitated, forming Mn- and Fe-mottled
and enriched layers. The Fe-enriched layer is more distinct and occurs shallower
Eh [mV]
a
b
c
Midseason
drainage
for a and b
Intermittent
irrigation for a,
and
submergence
for b and c.
Drainage for all
Fig. 5.4 Changes in soil redox potential values (Eh) with different water management schemes. (a)
Midseason drainage and intermittent irrigation (MI), (b) midseason drainage and submergence
(MS), (c) continuous submergence (CS). The error bars show the absolute deviation from the mean
(n ¼ 2)
5.1 Introduction
103
fields. At the start of drainage, the Eh value of plot (a) was already higher than those
of the other plots due to its treatment by midseason drainage followed by intermittent
irrigation. The Eh value of plot (c) was the lowest, even after drainage started, due to
continuous submergence, which may have delayed drainage compared to plot (b).
As a result of redox reactions caused by the water management schemes, the
paddy field plow layer soils show periodic chemical changes every year. Directly
under the plow layer soil, the plow pan, also common to paddy field soils, is formed.
The plow pan is 5–10 cm thick, hard, and sometimes has weakly developed platy
structure with hydrated iron oxide coating or mottles. In contrast, the properties of
the lower horizon soils under the plow pan are mainly related to topography and
ground water level, as well as related to redox reactions. Paddy fields can be divided
into two types: well-drained and poorly drained (Kyuma et al. 1988; Wada and Neue
1988). Intermediate types also exist.
Well-drained paddy fields are distributed in relatively well-drained areas, such as
uplands or natural levees in lowland areas. The lower horizon soils underlain by the
plow pan are unsaturated with water and oxidative at least during the time when the
paddy field is not submerged. As the plow layer soil is reduced under submergence
with water permeability of approximately 2–3 cm d
À1 , Mn
2+ and Fe
2+ are gradually
transported to the subsoil, oxidized, and precipitated, forming Mn- and Fe-mottled
and enriched layers. The Fe-enriched layer is more distinct and occurs shallower
Eh [mV]
a
b
c
Midseason
drainage
for a and b
Intermittent
irrigation for a,
and
submergence
for b and c.
Drainage for all
Fig. 5.4 Changes in soil redox potential values (Eh) with different water management schemes. (a)
Midseason drainage and intermittent irrigation (MI), (b) midseason drainage and submergence
(MS), (c) continuous submergence (CS). The error bars show the absolute deviation from the mean
(n ¼ 2)
5.1 Introduction
103