

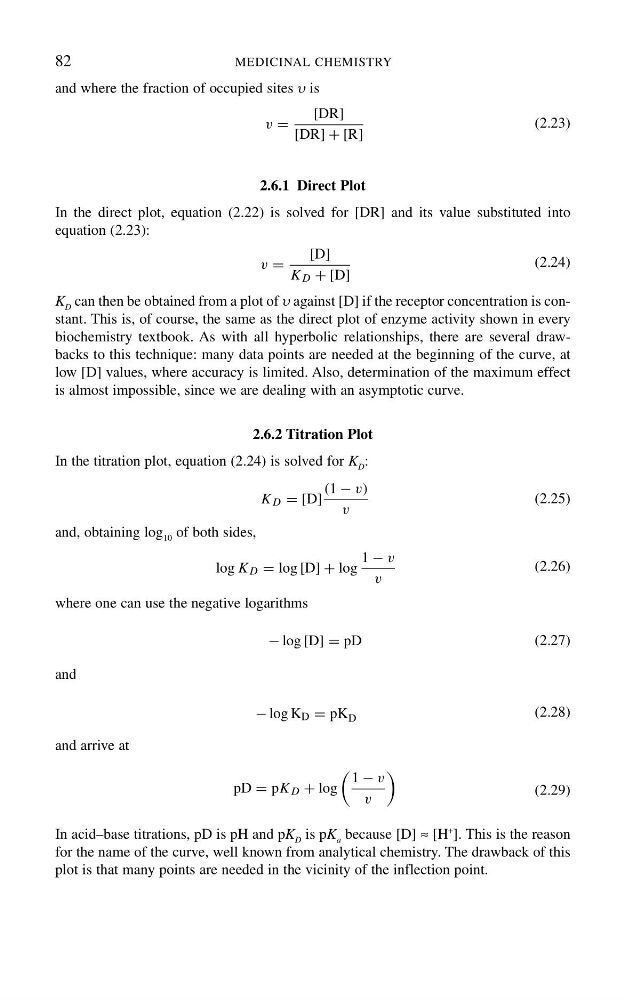
and where the fraction of occupied sites υ is
2.6.1 Direct Plot
In the direct plot, equation (2.22) is solved for [DR] and its value substituted into
equation (2.23):
K D can then be obtained from a plot of υ against [D] if the receptor concentration is constant. This is, of course, the same as the direct plot of enzyme activity shown in every
biochemistry textbook. As with all hyperbolic relationships, there are several drawbacks to this technique: many data points are needed at the beginning of the curve, at
low [D] values, where accuracy is limited. Also, determination of the maximum effect
is almost impossible, since we are dealing with an asymptotic curve.
2.6.2 Titration Plot
In the titration plot, equation (2.24) is solved for K D :
and, obtaining log 10 of both sides,
where one can use the negative logarithms
and
and arrive at
In acid–base titrations, pD is pH and pK D is pK a because [D] ≈ [H
+
]. This is the reason
for the name of the curve, well known from analytical chemistry. The drawback of this
plot is that many points are needed in the vicinity of the inflection point.
82
MEDICINAL CHEMISTRY
v =
[DR]
[DR] + [R]
(2.23)
v =
[D]
K D + [D]
(2.24)
K D = [D]
(1 − v)
v
(2.25)
log K D = log [D] + log
1 − v
v
(2.26)
− log [D] = pD
(2.27)
− log K D = pK D
(2.28)
pD = pK D + log
1 − v
v
(2.29)
2.6.1 Direct Plot
In the direct plot, equation (2.22) is solved for [DR] and its value substituted into
equation (2.23):
K D can then be obtained from a plot of υ against [D] if the receptor concentration is constant. This is, of course, the same as the direct plot of enzyme activity shown in every
biochemistry textbook. As with all hyperbolic relationships, there are several drawbacks to this technique: many data points are needed at the beginning of the curve, at
low [D] values, where accuracy is limited. Also, determination of the maximum effect
is almost impossible, since we are dealing with an asymptotic curve.
2.6.2 Titration Plot
In the titration plot, equation (2.24) is solved for K D :
and, obtaining log 10 of both sides,
where one can use the negative logarithms
and
and arrive at
In acid–base titrations, pD is pH and pK D is pK a because [D] ≈ [H
+
]. This is the reason
for the name of the curve, well known from analytical chemistry. The drawback of this
plot is that many points are needed in the vicinity of the inflection point.
82
MEDICINAL CHEMISTRY
v =
[DR]
[DR] + [R]
(2.23)
v =
[D]
K D + [D]
(2.24)
K D = [D]
(1 − v)
v
(2.25)
log K D = log [D] + log
1 − v
v
(2.26)
− log [D] = pD
(2.27)
− log K D = pK D
(2.28)
pD = pK D + log
1 − v
v
(2.29)