

Potency refers to the dose of a drug required to produce a specific effect of given
magnitude as compared to a standard reference. Potency is dependent upon both affinity
and efficacy.
The median effective dose (ED 50 ) is the amount of a drug required for half-maximal
effect, or to produce an effect in 50% of a group of experimental animals. It is usually
expressed as mg/kg body weight. The in vitro ED 50 should be expressed as a molar concentration (EC 50 ) rather than as an absolute amount. The median inhibitory concentration (IC 50 ) is the concentration at which an antagonist exerts its half-maximal effect.
The median toxic dose (TD 50 ) is the dose required to produce a particular toxic effect
in 50% of animals or subjects. If that toxic effect is death, then a median lethal dose
(LD 50 ) may be defined. The therapeutic index is the ratio of TD 50 to the ED 50 .
The term pD 2 refers to the negative logarithm of the molar concentration of an agonist necessary for half-maximal effect. It is thus a measure of affinity under ideal conditions (i.e., a linear dose–response relationship). The pA 2 is the negative logarithm of
the molar concentration of an antagonist that necessitates the doubling of the agonist
dose to counteract the effect of that antagonist and restore the original response.
Since the drug–receptor interaction ultimately leads to a biological or clinical
response, several other terms should also be defined at this point. With some drugs, the
intensity of the response to a given dose may decrease over a period of time; this is the
phenomenon of tolerance. An individual patient may be either hyporeactive or hyperreactive to a drug in that the patient’s unique receptor-mediated response to a given
dose of that drug may be either decreased or increased relative to the general population. Sometimes, individuals experience an idiosyncratic response to a drug, that is, a
response that is infrequently observed in most patients.
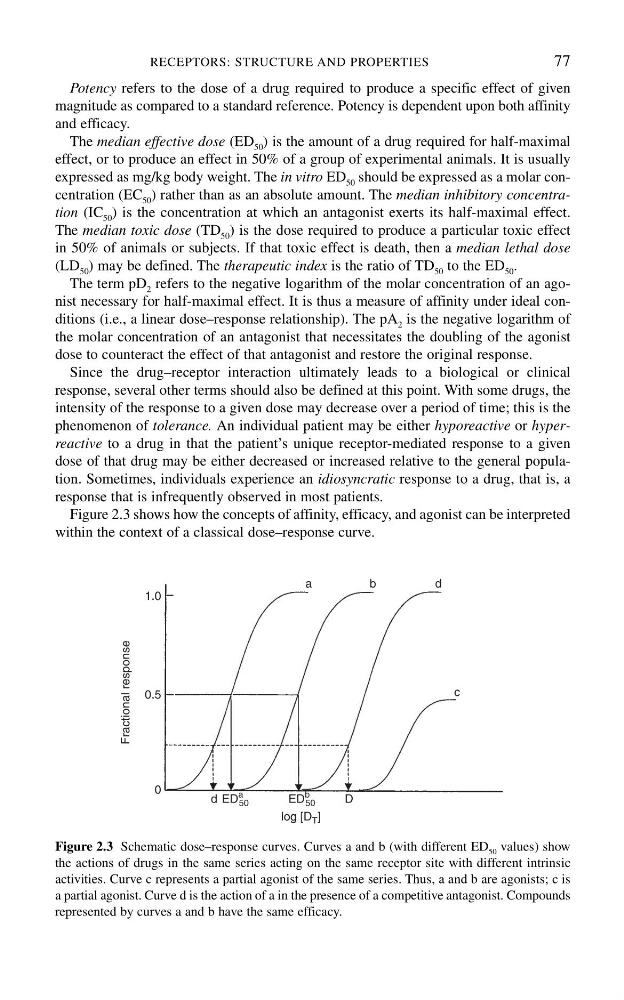
Figure 2.3 shows how the concepts of affinity, efficacy, and agonist can be interpreted
within the context of a classical dose–response curve.
RECEPTORS: STRUCTURE AND PROPERTIES
77
Figure 2.3 Schematic dose–response curves. Curves a and b (with different ED 50 values) show
the actions of drugs in the same series acting on the same receptor site with different intrinsic
activities. Curve c represents a partial agonist of the same series. Thus, a and b are agonists; c is
a partial agonist. Curve d is the action of a in the presence of a competitive antagonist. Compounds
represented by curves a and b have the same efficacy.
magnitude as compared to a standard reference. Potency is dependent upon both affinity
and efficacy.
The median effective dose (ED 50 ) is the amount of a drug required for half-maximal
effect, or to produce an effect in 50% of a group of experimental animals. It is usually
expressed as mg/kg body weight. The in vitro ED 50 should be expressed as a molar concentration (EC 50 ) rather than as an absolute amount. The median inhibitory concentration (IC 50 ) is the concentration at which an antagonist exerts its half-maximal effect.
The median toxic dose (TD 50 ) is the dose required to produce a particular toxic effect
in 50% of animals or subjects. If that toxic effect is death, then a median lethal dose
(LD 50 ) may be defined. The therapeutic index is the ratio of TD 50 to the ED 50 .
The term pD 2 refers to the negative logarithm of the molar concentration of an agonist necessary for half-maximal effect. It is thus a measure of affinity under ideal conditions (i.e., a linear dose–response relationship). The pA 2 is the negative logarithm of
the molar concentration of an antagonist that necessitates the doubling of the agonist
dose to counteract the effect of that antagonist and restore the original response.
Since the drug–receptor interaction ultimately leads to a biological or clinical
response, several other terms should also be defined at this point. With some drugs, the
intensity of the response to a given dose may decrease over a period of time; this is the
phenomenon of tolerance. An individual patient may be either hyporeactive or hyperreactive to a drug in that the patient’s unique receptor-mediated response to a given
dose of that drug may be either decreased or increased relative to the general population. Sometimes, individuals experience an idiosyncratic response to a drug, that is, a
response that is infrequently observed in most patients.
Figure 2.3 shows how the concepts of affinity, efficacy, and agonist can be interpreted
within the context of a classical dose–response curve.
RECEPTORS: STRUCTURE AND PROPERTIES
77
Figure 2.3 Schematic dose–response curves. Curves a and b (with different ED 50 values) show
the actions of drugs in the same series acting on the same receptor site with different intrinsic
activities. Curve c represents a partial agonist of the same series. Thus, a and b are agonists; c is
a partial agonist. Curve d is the action of a in the presence of a competitive antagonist. Compounds
represented by curves a and b have the same efficacy.