

78
Graphical Representation
[
^(y 1 — y) — wi **(Xi %/ I
f£to\
n - 2
J
(6
'
18a)
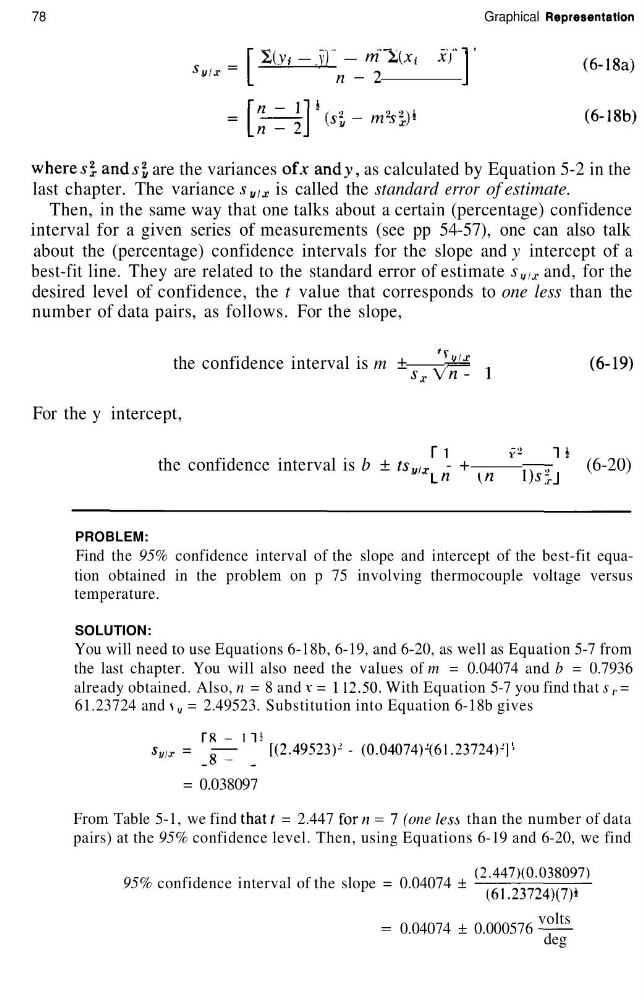
and.s£ are the variances of* andy, as calculated by Equation 5-2 in the
last chapter. The variance s vix is called the standard error of estimate.
Then, in the same way that one talks about a certain (percentage) confidence
interval for a given series of measurements (see pp 54-57), one can also talk
about the (percentage) confidence intervals for the slope and y intercept of a
best-fit line. They are related to the standard error of estimate 5 tf/J . and, for the
desired level of confidence, the t value that corresponds to one less than the
number of data pairs, as follows. For the slope,
the confidence interval is m ±
/
;j ,
(6-19)
s f Vn - 1
For the y intercept,
the confidence interval is b ± ts ulx - +
-r—^(6-20)
L fz \n
U^.rJ
PROBLEM:
Find the 95% confidence interval of the slope and intercept of the best-fit equation obtained in the problem on p 75 involving thermocouple voltage versus
temperature.
SOLUTION:
You will need to use Equations 6-18b, 6-19, and 6-20, as well as Equation 5-7 from
the last chapter. You will also need the values of m = 0.04074 and b = 0.7936
already obtained. Also, n = 8 and v = 1 12.50. With Equation 5-7 you find that s r =
61.23724 and s v = 2.49523. Substitution into Equation 6-18b gives
s ylx = §—
[(2.49523^ - (0.04074)-(61. 23724)-] ' •
= 0.038097
From Table 5-1, we find that? = 2.447 forn =7 (one lest, than the number of data
pairs) at the 95% confidence level. Then, using Equations 6-19 and 6-20, we find
95% confidence interval of the slope = 0.04074 ±
= 0.04074 ± 0.000576
(61.23724)(7)
i
volts
deg
Graphical Representation
[
^(y 1 — y) — wi **(Xi %/ I
f£to\
n - 2
J
(6
'
18a)
and.s£ are the variances of* andy, as calculated by Equation 5-2 in the
last chapter. The variance s vix is called the standard error of estimate.
Then, in the same way that one talks about a certain (percentage) confidence
interval for a given series of measurements (see pp 54-57), one can also talk
about the (percentage) confidence intervals for the slope and y intercept of a
best-fit line. They are related to the standard error of estimate 5 tf/J . and, for the
desired level of confidence, the t value that corresponds to one less than the
number of data pairs, as follows. For the slope,
the confidence interval is m ±
/
;j ,
(6-19)
s f Vn - 1
For the y intercept,
the confidence interval is b ± ts ulx - +
-r—^(6-20)
L fz \n
U^.rJ
PROBLEM:
Find the 95% confidence interval of the slope and intercept of the best-fit equation obtained in the problem on p 75 involving thermocouple voltage versus
temperature.
SOLUTION:
You will need to use Equations 6-18b, 6-19, and 6-20, as well as Equation 5-7 from
the last chapter. You will also need the values of m = 0.04074 and b = 0.7936
already obtained. Also, n = 8 and v = 1 12.50. With Equation 5-7 you find that s r =
61.23724 and s v = 2.49523. Substitution into Equation 6-18b gives
s ylx = §—
[(2.49523^ - (0.04074)-(61. 23724)-] ' •
= 0.038097
From Table 5-1, we find that? = 2.447 forn =7 (one lest, than the number of data
pairs) at the 95% confidence level. Then, using Equations 6-19 and 6-20, we find
95% confidence interval of the slope = 0.04074 ±
= 0.04074 ± 0.000576
(61.23724)(7)
i
volts
deg