

76
Graphical Representation
Note that the method of least squares will give you values of m and b more
accurate than those you could obtain directly from the graph Also you now have
a simple and unequivocal basis for drawing the best-fit line The easiest approach
is to locate two points accurately, then draw a line through them For one point
use b, the y intercept corresponding to T = 0°C For the other point use some
simple value of T, such as 100°C, which corresponds to V = 4 074 - 0 794 =
3 280 Drawing the line through these two points, (0, -0 794) and (100, 3 280) will
give the graph shown in Figure 6-2
Usually it is a good idea to plot the experimental points first (but not draw a line
that represents them) so that, if there should happen to be a really bad point that
clearly doesn't represent the experiment (due probably to a serious experimental
error), you could omit this point when using the method of least squares You
should still show the bad point on the graph, but with a note that it was not included
in determining the equation of the best fit line that is drawn
Correlation Coefficient
Whenever you get the equation for the best-fit line, or draw its graphical representation, there is the question of how well the equation represents the data,
or how good the correlation is between x and > We can find the answer to this
question as follows
The choice of which variable is* and which isy is arbitrary but, in the method
of least squares, whichever is chosen asy is assumed to possess all of the error,
and* is assumed to possess none If the variables were interchanged (that is, if*
andy were plotted the other way around), this assumption would be reversed,
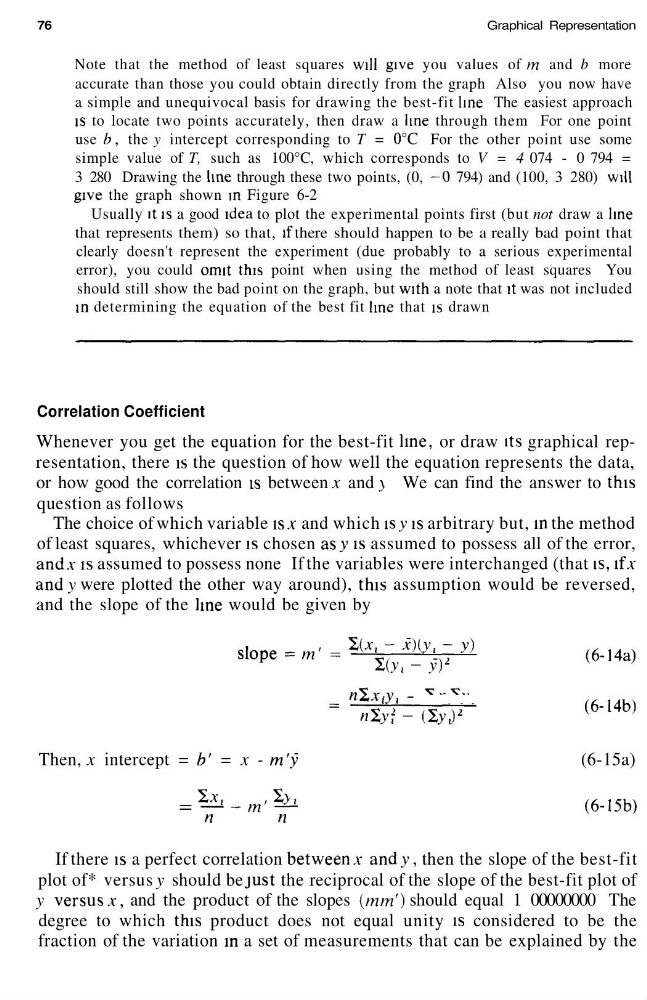
and the slope of the line would be given by
slope ^^
-
, ,
(6 '
14b)
Then, x intercept = b' = x - m'y
(6-15a)
= ^-/n'^i
(6-15b)
n
n
If there is a perfect correlation between* andy, then the slope of the best-fit
plot of* versus y should be just the reciprocal of the slope of the best-fit plot of
y versus*, and the product of the slopes (mm
1 ) should equal 1 00000000 The
degree to which this product does not equal unity is considered to be the
fraction of the variation in a set of measurements that can be explained by the
Graphical Representation
Note that the method of least squares will give you values of m and b more
accurate than those you could obtain directly from the graph Also you now have
a simple and unequivocal basis for drawing the best-fit line The easiest approach
is to locate two points accurately, then draw a line through them For one point
use b, the y intercept corresponding to T = 0°C For the other point use some
simple value of T, such as 100°C, which corresponds to V = 4 074 - 0 794 =
3 280 Drawing the line through these two points, (0, -0 794) and (100, 3 280) will
give the graph shown in Figure 6-2
Usually it is a good idea to plot the experimental points first (but not draw a line
that represents them) so that, if there should happen to be a really bad point that
clearly doesn't represent the experiment (due probably to a serious experimental
error), you could omit this point when using the method of least squares You
should still show the bad point on the graph, but with a note that it was not included
in determining the equation of the best fit line that is drawn
Correlation Coefficient
Whenever you get the equation for the best-fit line, or draw its graphical representation, there is the question of how well the equation represents the data,
or how good the correlation is between x and > We can find the answer to this
question as follows
The choice of which variable is* and which isy is arbitrary but, in the method
of least squares, whichever is chosen asy is assumed to possess all of the error,
and* is assumed to possess none If the variables were interchanged (that is, if*
andy were plotted the other way around), this assumption would be reversed,
and the slope of the line would be given by
slope ^^
-
, ,
(6 '
14b)
Then, x intercept = b' = x - m'y
(6-15a)
= ^-/n'^i
(6-15b)
n
n
If there is a perfect correlation between* andy, then the slope of the best-fit
plot of* versus y should be just the reciprocal of the slope of the best-fit plot of
y versus*, and the product of the slopes (mm
1 ) should equal 1 00000000 The
degree to which this product does not equal unity is considered to be the
fraction of the variation in a set of measurements that can be explained by the