

listribution of Errors
57
iverage of our values. Because the average of many measurements is more
ikely to be correct than the average of a few, our confidence interval should get
smaller as we increase the number of measurements. This is commonly exjressed quantitatively by using the standard deviation of the mean, defined as
-
L -=. = standard deviation of the mean
Vn
Mote that the standard deviation of the mean decreases with the square root of
i, not the first power. Thus, making 100 measurements rather than 4 does not
mprove the precision by a factor of'T = 25, but only by a factor of V25, or 5.
Fhe useful statement we can make with the standard deviation of the mean is
the following: for a series of n measurements and a specified confidence level,
the true value ofx will lie in the interval
x ± t f 4=)
<
5 -
6 )
\Vrt7
This is a statement of the precision of the mean.
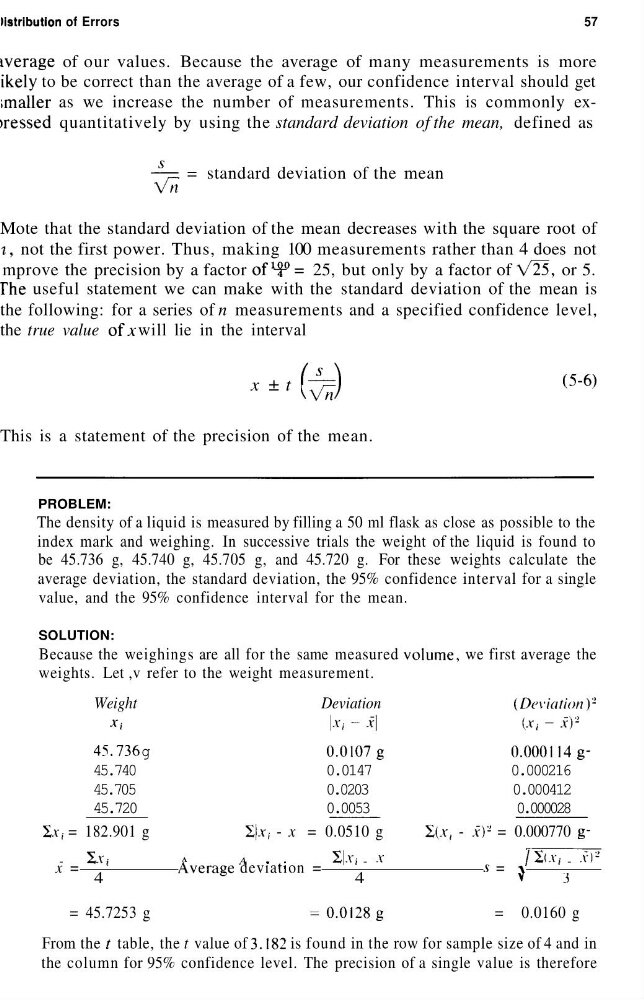
PROBLEM:
The density of a liquid is measured by filling a 50 ml flask as close as possible to the
index mark and weighing. In successive trials the weight of the liquid is found to
be 45.736 g, 45.740 g, 45.705 g, and 45.720 g. For these weights calculate the
average deviation, the standard deviation, the 95% confidence interval for a single
value, and the 95% confidence interval for the mean.
SOLUTION:
Because the weighings are all for the same measured volume, we first average the
weights. Let ,v refer to the weight measurement.
Weight
Deviation
(Deviation)*
45. 736 g
0.0107g
0.0001 14 g45.740
0.0147
0.000216
45.705
0.0203
0.000412
45.720
0.0053
0.000028
IY, = 182.901 g
2|.Y ( - x = 0.0510 g
-
2 -
V i
A
A
' >•
S.Y, - .Y
/2(.Y, - .Y)
2
x =
Average deviation =
. « = \
4
4
"
3
= 45.7253 g
=O.OI28g
= 0.0160 g
From the ; table, the t value of 3.182 is found in the row for sample size of 4 and in
the column for 95% confidence level. The precision of a single value is therefore
57
iverage of our values. Because the average of many measurements is more
ikely to be correct than the average of a few, our confidence interval should get
smaller as we increase the number of measurements. This is commonly exjressed quantitatively by using the standard deviation of the mean, defined as
-
L -=. = standard deviation of the mean
Vn
Mote that the standard deviation of the mean decreases with the square root of
i, not the first power. Thus, making 100 measurements rather than 4 does not
mprove the precision by a factor of'T = 25, but only by a factor of V25, or 5.
Fhe useful statement we can make with the standard deviation of the mean is
the following: for a series of n measurements and a specified confidence level,
the true value ofx will lie in the interval
x ± t f 4=)
<
5 -
6 )
\Vrt7
This is a statement of the precision of the mean.
PROBLEM:
The density of a liquid is measured by filling a 50 ml flask as close as possible to the
index mark and weighing. In successive trials the weight of the liquid is found to
be 45.736 g, 45.740 g, 45.705 g, and 45.720 g. For these weights calculate the
average deviation, the standard deviation, the 95% confidence interval for a single
value, and the 95% confidence interval for the mean.
SOLUTION:
Because the weighings are all for the same measured volume, we first average the
weights. Let ,v refer to the weight measurement.
Weight
Deviation
(Deviation)*
45. 736 g
0.0107g
0.0001 14 g45.740
0.0147
0.000216
45.705
0.0203
0.000412
45.720
0.0053
0.000028
IY, = 182.901 g
2|.Y ( - x = 0.0510 g
-
2 -
V i
A
A
' >•
S.Y, - .Y
/2(.Y, - .Y)
2
x =
Average deviation =
. « = \
4
4
"
3
= 45.7253 g
=O.OI28g
= 0.0160 g
From the ; table, the t value of 3.182 is found in the row for sample size of 4 and in
the column for 95% confidence level. The precision of a single value is therefore