

55
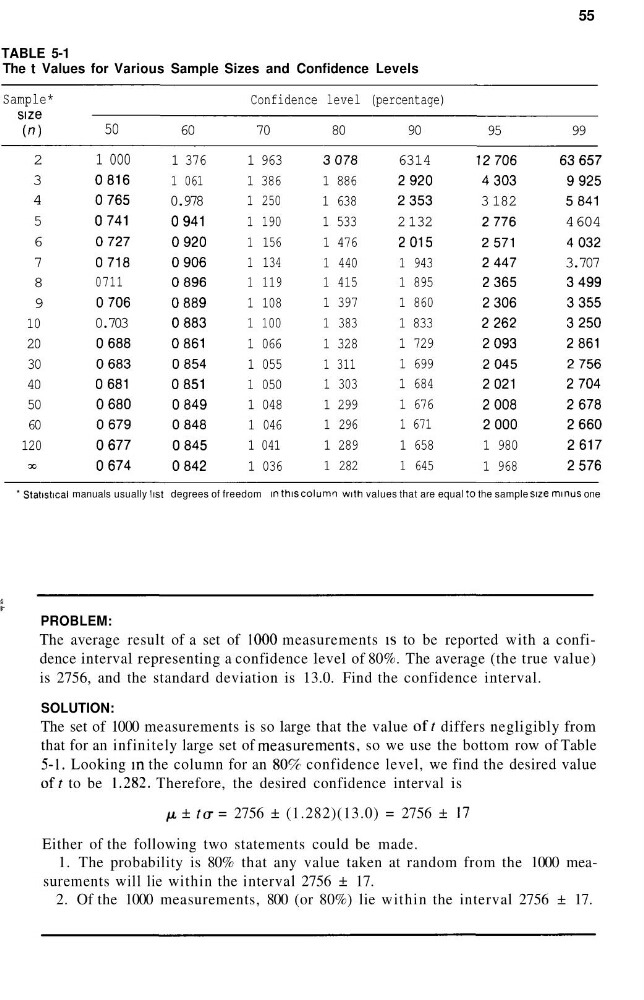
TABLE 5-1
The t Values for Various Sample Sizes and Confidence Levels
Sample*
size
(n)
2
3
4
5
6
7
8
9
10
20
30
40
50
60
120
00
Confidence level (percentage)
50
1 000
0816
0765
0741
0727
0718
0711
0706
0.703
0688
0683
0681
0680
0679
0677
0674
60
1 376
1 061
0.978
0941
0920
0906
0896
0889
0883
0861
0854
0851
0849
0848
0845
0842
70
1 963
1 386
1 250
1 190
1 156
1 134
1 119
1 108
1 100
1 066
1 055
1 050
1 048
1 046
1 041
1 036
80
3078
1 886
1 638
1 533
1 476
1 440
1 415
1 397
1 383
1 328
1 311
1 303
1 299
1 296
1 289
1 282
90
6314
2920
2353
2 132
2015
1 943
1 895
1 860
1 833
1 729
1 699
1 684
1 676
1 671
1 658
1 645
95
12706
4303
3 182
2776
2571
2447
2365
2306
2262
2093
2045
2021
2008
2000
1 980
1 968
99
63657
9925
5841
4 604
4032
3.707
3499
3355
3250
2861
2756
2704
2678
2660
2617
2576
* Statistical manuals usually list degrees of freedom in this column with values that are equal to the sample size minus one
PROBLEM:
The average result of a set of 1000 measurements is to be reported with a confidence interval representing a confidence level of 80%. The average (the true value)
is 2756, and the standard deviation is 13.0. Find the confidence interval.
SOLUTION:
The set of 1000 measurements is so large that the value of? differs negligibly from
that for an infinitely large set of measurements, so we use the bottom row of Table
5-1. Looking in the column for an 80% confidence level, we find the desired value
of? to be 1.282. Therefore, the desired confidence interval is
H ± to- = 2756 ± (1.282)(13.0) = 2756 ± 17
Either of the following two statements could be made.
1. The probability is 80% that any value taken at random from the 1000 measurements will lie within the interval 2756 ± 17.
2. Of the 1000 measurements, 800 (or 80%) lie within the interval 2756 ± 17.
TABLE 5-1
The t Values for Various Sample Sizes and Confidence Levels
Sample*
size
(n)
2
3
4
5
6
7
8
9
10
20
30
40
50
60
120
00
Confidence level (percentage)
50
1 000
0816
0765
0741
0727
0718
0711
0706
0.703
0688
0683
0681
0680
0679
0677
0674
60
1 376
1 061
0.978
0941
0920
0906
0896
0889
0883
0861
0854
0851
0849
0848
0845
0842
70
1 963
1 386
1 250
1 190
1 156
1 134
1 119
1 108
1 100
1 066
1 055
1 050
1 048
1 046
1 041
1 036
80
3078
1 886
1 638
1 533
1 476
1 440
1 415
1 397
1 383
1 328
1 311
1 303
1 299
1 296
1 289
1 282
90
6314
2920
2353
2 132
2015
1 943
1 895
1 860
1 833
1 729
1 699
1 684
1 676
1 671
1 658
1 645
95
12706
4303
3 182
2776
2571
2447
2365
2306
2262
2093
2045
2021
2008
2000
1 980
1 968
99
63657
9925
5841
4 604
4032
3.707
3499
3355
3250
2861
2756
2704
2678
2660
2617
2576
* Statistical manuals usually list degrees of freedom in this column with values that are equal to the sample size minus one
PROBLEM:
The average result of a set of 1000 measurements is to be reported with a confidence interval representing a confidence level of 80%. The average (the true value)
is 2756, and the standard deviation is 13.0. Find the confidence interval.
SOLUTION:
The set of 1000 measurements is so large that the value of? differs negligibly from
that for an infinitely large set of measurements, so we use the bottom row of Table
5-1. Looking in the column for an 80% confidence level, we find the desired value
of? to be 1.282. Therefore, the desired confidence interval is
H ± to- = 2756 ± (1.282)(13.0) = 2756 ± 17
Either of the following two statements could be made.
1. The probability is 80% that any value taken at random from the 1000 measurements will lie within the interval 2756 ± 17.
2. Of the 1000 measurements, 800 (or 80%) lie within the interval 2756 ± 17.