

Tltration Curves
365
[H+]
2 = [BH+]K h =
[BH+]1Q-'
4
[saltjlQ14
K,
~
K t
—, where K, is for the base, B
TITRATION CURVES
When an acid or base solution is titrated, each addition of reagent causes a
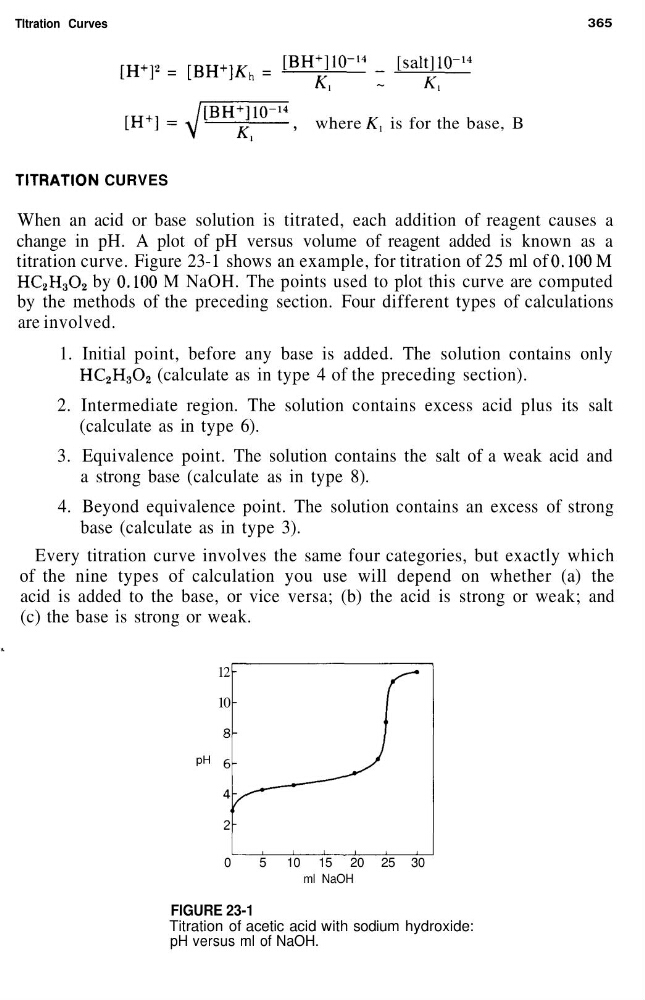
change in pH. A plot of pH versus volume of reagent added is known as a
titration curve. Figure 23-1 shows an example, for titration of 25 ml of 0.100 M
HC 2 H 3 O 2 by 0.100 M NaOH. The points used to plot this curve are computed
by the methods of the preceding section. Four different types of calculations
are involved.
1. Initial point, before any base is added. The solution contains only
HC 2 H 3 O 2 (calculate as in type 4 of the preceding section).
2. Intermediate region. The solution contains excess acid plus its salt
(calculate as in type 6).
3. Equivalence point. The solution contains the salt of a weak acid and
a strong base (calculate as in type 8).
4. Beyond equivalence point. The solution contains an excess of strong
base (calculate as in type 3).
Every titration curve involves the same four categories, but exactly which
of the nine types of calculation you use will depend on whether (a) the
acid is added to the base, or vice versa; (b) the acid is strong or weak; and
(c) the base is strong or weak.
12
10
pH
0
5
10 15 20 25 30
ml NaOH
FIGURE 23-1
Titration of acetic acid with sodium hydroxide:
pH versus ml of NaOH.
365
[H+]
2 = [BH+]K h =
[BH+]1Q-'
4
[saltjlQ14
K,
~
K t
—, where K, is for the base, B
TITRATION CURVES
When an acid or base solution is titrated, each addition of reagent causes a
change in pH. A plot of pH versus volume of reagent added is known as a
titration curve. Figure 23-1 shows an example, for titration of 25 ml of 0.100 M
HC 2 H 3 O 2 by 0.100 M NaOH. The points used to plot this curve are computed
by the methods of the preceding section. Four different types of calculations
are involved.
1. Initial point, before any base is added. The solution contains only
HC 2 H 3 O 2 (calculate as in type 4 of the preceding section).
2. Intermediate region. The solution contains excess acid plus its salt
(calculate as in type 6).
3. Equivalence point. The solution contains the salt of a weak acid and
a strong base (calculate as in type 8).
4. Beyond equivalence point. The solution contains an excess of strong
base (calculate as in type 3).
Every titration curve involves the same four categories, but exactly which
of the nine types of calculation you use will depend on whether (a) the
acid is added to the base, or vice versa; (b) the acid is strong or weak; and
(c) the base is strong or weak.
12
10
pH
0
5
10 15 20 25 30
ml NaOH
FIGURE 23-1
Titration of acetic acid with sodium hydroxide:
pH versus ml of NaOH.