

POLAR COORDINATES
291
35.23 Transform the rectangular equation xy = 4 into a polar equation.
r cosfl -rsin 0 = 4, r
2 sin 0 cos 0 = 4, r
2 (sin20)/2 = 4, r
2 = 8csc20.
35.24 Transform the rectangular equation x = 3 into a polar equation.
/•cos 6=3, r = 3secft
35.25 Transform the rectangular equation x + 2y = 3 into a polar equation.
rcos0 + 2rsin0 = 3, r(cos 0 + 2 sin 0) = 3, r = 3/(cos 0 + 2sin 0).
35.26 Find a rectangular equation equivalent to the polar equation 0 = 77/3.
tan 0 = tan (77/3) = VS. Hence, y/x = V3, y = V3x.
35.27 Find a rectangular equation equivalent to the polar equation r = tan 0.
~y/x, x
2 + y
2 = y
2 /x
2 , y
2 = x
2 (x
2 + y
2 ), y
2 = x* + x
2 y
2 , y
2 (l-x
2 ) = x
4 , y
2 = x 2 ).
35.28 Show that the point with polar coordinates (3,377/4) lies on the curve r = 3 sin 20.
Observe that r = 3, 0 = 377/4 do not satisfy the equation r = 3sin20. However (Problem 35.1), the
point with polar coordinates (3, 377/4) also has polar coordinates (—3, ?77/4), and r=— 3, 0 = 77r/4 satisfy
the equation r = 3sin20, since 3 sin 2(7 77/4) = 3sin(777-/2) = 3(-l) = -3.
35.29 Show that the point with polar coordinates (3,377/2) lies on the curve with the polar equation r
2 = 9 sin 0.
Notice that r = 3, 0 = 3i7/2 do not satisfy the equation r
2 = 9sin0. However, the point with polar
coordinates (3,377/2) also has polar coordinates (-3, 7r/2), and r = -3, 0 = 77/2 satisfy the equation
r
2 = 9 sin 0, since (-3)
2 = 9 • 1.
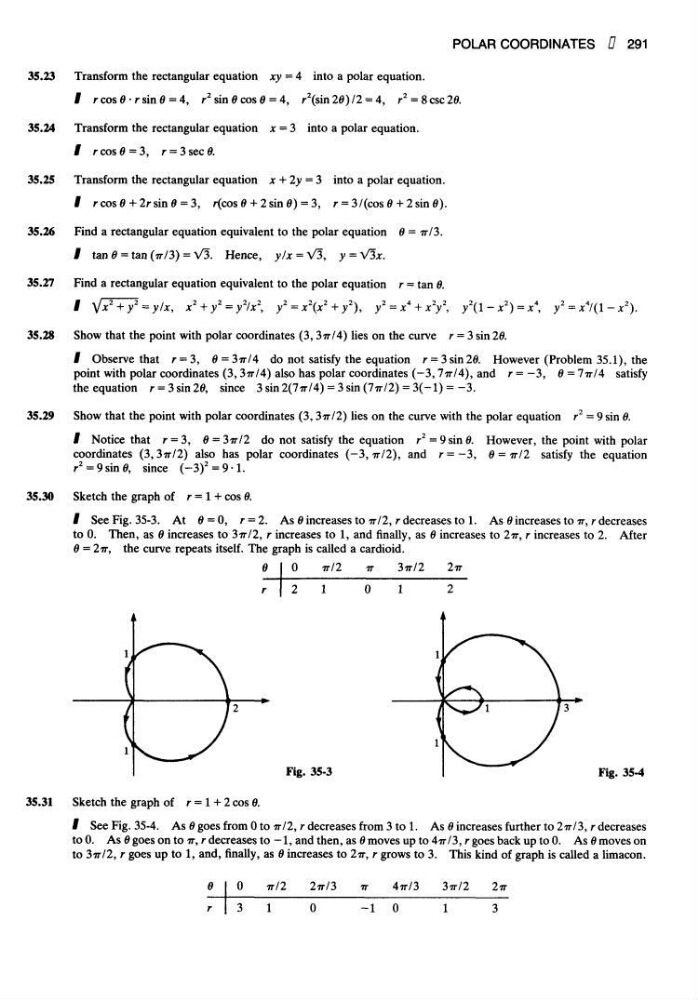
35.30 Sketch the graph of r = 1 + cos ft
See Fig. 35-3. At 0 = 0, r = 2. As 0 increases to 77/2, r decreases to 1. As 0 increases to 77, r decreases
to 0. Then, as 0 increases to 377/2, r increases to 1, and finally, as 0 increases to 2i7, r increases to 2. After
0 = 277, the curve repeats itself. The graph is called a cardioid.
Fig. 35-3
Fig. 35-4
35.31 Sketch the graph of r = 1 + 2 cos 0.
See Fig. 35-4. As 0 goes from 0 to 77/2, r decreases from 3 to 1. As 0 increases further to 277/3, r decreases
to 0. As 0 goes on to 77, r decreases to — 1, and then, as 0 moves up to 477/3, r goes back up to 0. As 0 moves on
to 377/2, r goes up to 1, and, finally, as 0 increases to 277, r grows to 3. This kind of graph is called a limacon.
0
r
0
3
it 12
1
277/3
0
IT
-1
47T/3
0
37T/2
1
27T
3
e
r
0
2
IT/2
1
•n
0
3ir/2
1
2 17
2
291
35.23 Transform the rectangular equation xy = 4 into a polar equation.
r cosfl -rsin 0 = 4, r
2 sin 0 cos 0 = 4, r
2 (sin20)/2 = 4, r
2 = 8csc20.
35.24 Transform the rectangular equation x = 3 into a polar equation.
/•cos 6=3, r = 3secft
35.25 Transform the rectangular equation x + 2y = 3 into a polar equation.
rcos0 + 2rsin0 = 3, r(cos 0 + 2 sin 0) = 3, r = 3/(cos 0 + 2sin 0).
35.26 Find a rectangular equation equivalent to the polar equation 0 = 77/3.
tan 0 = tan (77/3) = VS. Hence, y/x = V3, y = V3x.
35.27 Find a rectangular equation equivalent to the polar equation r = tan 0.
~y/x, x
2 + y
2 = y
2 /x
2 , y
2 = x
2 (x
2 + y
2 ), y
2 = x* + x
2 y
2 , y
2 (l-x
2 ) = x
4 , y
2 = x 2 ).
35.28 Show that the point with polar coordinates (3,377/4) lies on the curve r = 3 sin 20.
Observe that r = 3, 0 = 377/4 do not satisfy the equation r = 3sin20. However (Problem 35.1), the
point with polar coordinates (3, 377/4) also has polar coordinates (—3, ?77/4), and r=— 3, 0 = 77r/4 satisfy
the equation r = 3sin20, since 3 sin 2(7 77/4) = 3sin(777-/2) = 3(-l) = -3.
35.29 Show that the point with polar coordinates (3,377/2) lies on the curve with the polar equation r
2 = 9 sin 0.
Notice that r = 3, 0 = 3i7/2 do not satisfy the equation r
2 = 9sin0. However, the point with polar
coordinates (3,377/2) also has polar coordinates (-3, 7r/2), and r = -3, 0 = 77/2 satisfy the equation
r
2 = 9 sin 0, since (-3)
2 = 9 • 1.
35.30 Sketch the graph of r = 1 + cos ft
See Fig. 35-3. At 0 = 0, r = 2. As 0 increases to 77/2, r decreases to 1. As 0 increases to 77, r decreases
to 0. Then, as 0 increases to 377/2, r increases to 1, and finally, as 0 increases to 2i7, r increases to 2. After
0 = 277, the curve repeats itself. The graph is called a cardioid.
Fig. 35-3
Fig. 35-4
35.31 Sketch the graph of r = 1 + 2 cos 0.
See Fig. 35-4. As 0 goes from 0 to 77/2, r decreases from 3 to 1. As 0 increases further to 277/3, r decreases
to 0. As 0 goes on to 77, r decreases to — 1, and then, as 0 moves up to 477/3, r goes back up to 0. As 0 moves on
to 377/2, r goes up to 1, and, finally, as 0 increases to 277, r grows to 3. This kind of graph is called a limacon.
0
r
0
3
it 12
1
277/3
0
IT
-1
47T/3
0
37T/2
1
27T
3
e
r
0
2
IT/2
1
•n
0
3ir/2
1
2 17
2