

Part II: The Answers
342
Answers
501–600
525.
3.24
In this example, the given function has values that are both positive and negative on
the given interval, so the Riemann sum approximates the value of
the area of the region above the -axis
that s bounded abov
x
’
e e by the function
the area of the region below the
−
x x -axis
that s bounded below by the function
’
You want to use six rectangles of equal width over the interval 0 ≤ x ≤ 5. Begin by
dividing the length of the interval by 6 to find the width of each rectangle:
∆ = − =
x 5 0
6
5
6
Then divide the interval [0, 5] into 6 equal pieces, each with a width of 5
6
, to get the
intervals 0 5
6
,
, 5
6
10
6
,
, 10
6
15
6
,
, 15
6
20
6
,
, 20
6
25
6
,
, and 25
6
5
,
. Using the right endpoint of each interval to calculate the height of the rectangles gives you the values
x = 5
6
, x = 10
6
, x = 15
6
, x = 20
6
, x = 25
6
, and x = 5. The height of each rectangle is f
(x).
(Note that a “negative height” indicates that the rectangle is below the x-axis.) To find
the Riemann sum, multiply the width of each rectangle by f
(x) and add the areas:
5
6
5
6
5
6
10
6
5
6
15
6
5
6
20
6
5
6
25
6
5
6
5
5
6
5
6
1
f
f
f
f
f
f
( ) ( ) ( ) ( ) ( ) ( )
+
+
+
+
+
=
−
+
− +
− +
− +
−
5
6
10
6
1 5
6
15
6
1 5
6
20
6
1 5
6
25
6
1
+
−
≈
5
6
5 1
3 24
.
526.
1.34
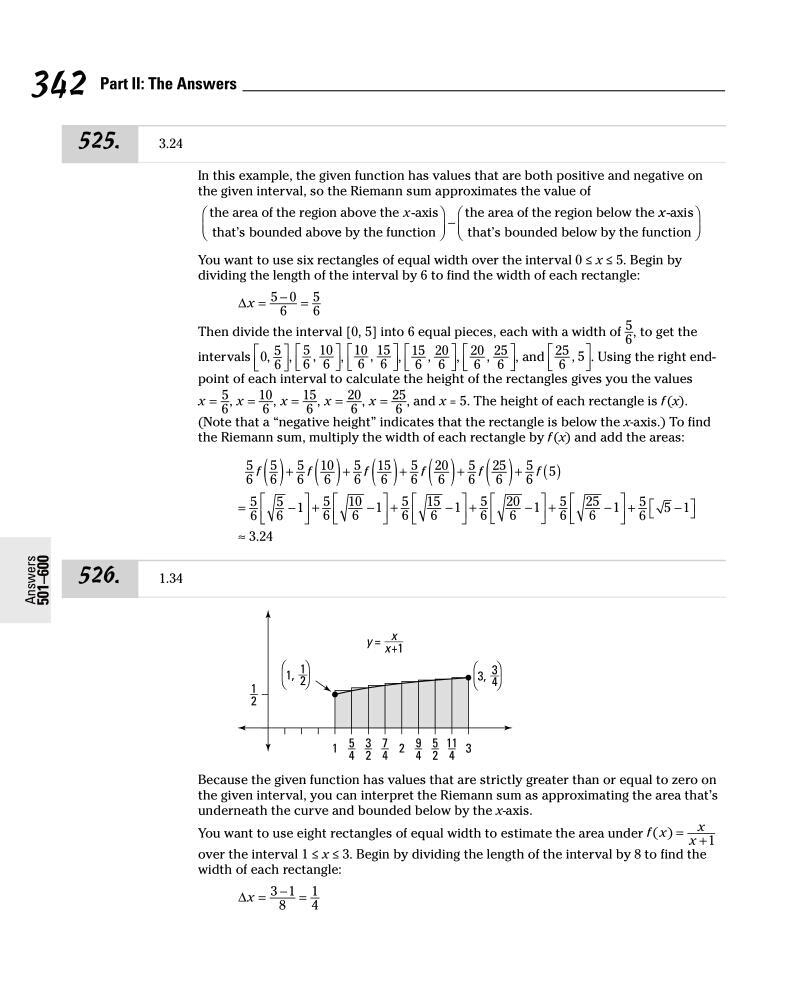
Because the given function has values that are strictly greater than or equal to zero on
the given interval, you can interpret the Riemann sum as approximating the area that’s
underneath the curve and bounded below by the x-axis.
You want to use eight rectangles of equal width to estimate the area under f x
x
x
( ) = + 1
over the interval 1 ≤ x ≤ 3. Begin by dividing the length of the interval by 8 to find the
width of each rectangle:
∆ = − =
x 3 1
8
1
4
342
Answers
501–600
525.
3.24
In this example, the given function has values that are both positive and negative on
the given interval, so the Riemann sum approximates the value of
the area of the region above the -axis
that s bounded abov
x
’
e e by the function
the area of the region below the
−
x x -axis
that s bounded below by the function
’
You want to use six rectangles of equal width over the interval 0 ≤ x ≤ 5. Begin by
dividing the length of the interval by 6 to find the width of each rectangle:
∆ = − =
x 5 0
6
5
6
Then divide the interval [0, 5] into 6 equal pieces, each with a width of 5
6
, to get the
intervals 0 5
6
,
, 5
6
10
6
,
, 10
6
15
6
,
, 15
6
20
6
,
, 20
6
25
6
,
, and 25
6
5
,
. Using the right endpoint of each interval to calculate the height of the rectangles gives you the values
x = 5
6
, x = 10
6
, x = 15
6
, x = 20
6
, x = 25
6
, and x = 5. The height of each rectangle is f
(x).
(Note that a “negative height” indicates that the rectangle is below the x-axis.) To find
the Riemann sum, multiply the width of each rectangle by f
(x) and add the areas:
5
6
5
6
5
6
10
6
5
6
15
6
5
6
20
6
5
6
25
6
5
6
5
5
6
5
6
1
f
f
f
f
f
f
( ) ( ) ( ) ( ) ( ) ( )
+
+
+
+
+
=
−
+
− +
− +
− +
−
5
6
10
6
1 5
6
15
6
1 5
6
20
6
1 5
6
25
6
1
+
−
≈
5
6
5 1
3 24
.
526.
1.34
Because the given function has values that are strictly greater than or equal to zero on
the given interval, you can interpret the Riemann sum as approximating the area that’s
underneath the curve and bounded below by the x-axis.
You want to use eight rectangles of equal width to estimate the area under f x
x
x
( ) = + 1
over the interval 1 ≤ x ≤ 3. Begin by dividing the length of the interval by 8 to find the
width of each rectangle:
∆ = − =
x 3 1
8
1
4