

This text was written 300 years before French mathematician BLAISE PASCAL was born. (Some historians believe
that this work in fact dates back 200 years earlier to the
writings of mathematician Jia Xian.) Scholars of this time
routinely used the triangle to approximate nth roots of
numbers using the equivalent of the BINOMIAL THEOREM
of today. They preferred their procedural methods of
extracting square roots to solve QUADRATIC equations,
rather than make use of the general quadratic formula.
Soon after JOHN NAPIER (1550–1617) of the West
published an account of his new calculating aid, the
NAPIER’S BONES, the Chinese developed an analogous
system of graded bamboo rods that could be used to
quickly compute long multiplications and divisions. It
is not known if the Chinese invented this system independently, or whether the idea was perhaps brought to
them by 17th-century Jesuit missionaries. Along with
the ABACUS developed in China 500 years earlier, the
calculating rods allowed for improved arithmetic computations, especially useful for the precise computations needed in astronomy.
Early scholar ZU CHONGZHI (ca. 500 C.E.) computed the volume of a sphere by a principle identical to
that of BONAVENTURA CAVALIERI (1598–1647).
See also MAGIC SQUARE.
chi-squared test The chi-squared test is a statistical
test (see STATISTICS: INFERENTIAL) used to determine
whether or not two characteristics of a population are
independent or associated in some way. For example,
imagine a social study looking for a possible correlation between the type of milk people prefer on their
cereal and the number of body piercings they possess.
Five hundred people were surveyed and the results
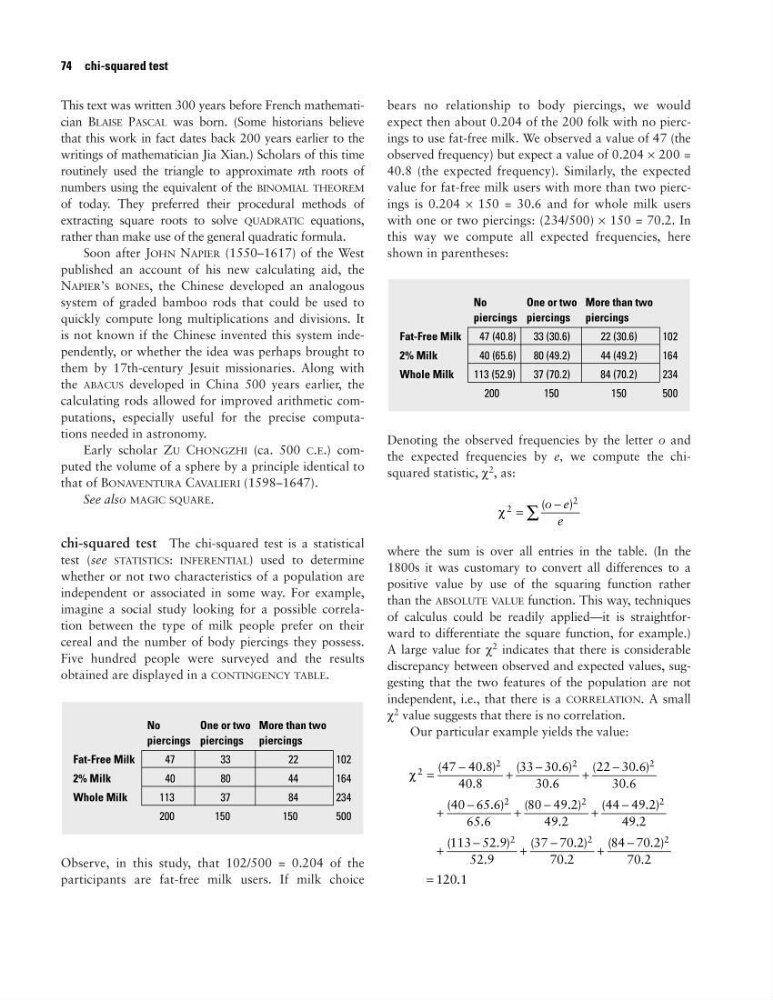
obtained are displayed in a CONTINGENCY TABLE.
Observe, in this study, that 102/500 = 0.204 of the
participants are fat-free milk users. If milk choice
bears no relationship to body piercings, we would
expect then about 0.204 of the 200 folk with no piercings to use fat-free milk. We observed a value of 47 (the
observed frequency) but expect a value of 0.204 × 200 =
40.8 (the expected frequency). Similarly, the expected
value for fat-free milk users with more than two piercings is 0.204 × 150 = 30.6 and for whole milk users
with one or two piercings: (234/500) × 150 = 70.2. In
this way we compute all expected frequencies, here
shown in parentheses:
Denoting the observed frequencies by the letter o and
the expected frequencies by e, we compute the chisquared statistic, χ
2 , as:
where the sum is over all entries in the table. (In the
1800s it was customary to convert all differences to a
positive value by use of the squaring function rather
than the ABSOLUTE VALUE function. This way, techniques
of calculus could be readily applied—it is straightforward to differentiate the square function, for example.)
A large value for χ
2 indicates that there is considerable
discrepancy between observed and expected values, suggesting that the two features of the population are not
independent, i.e., that there is a CORRELATION. A small
χ
2 value suggests that there is no correlation.
Our particular example yields the value:
χ
2
2
2
2
2
2
2
2
2
2
47 40 8
40 8
33 30 6
30 6
22 30 6
30 6
40 65 6
65 6
80 49 2
49 2
44 49 2
49 2
113 52 9
52 9
37 70 2
70 2
84 70 2
70 2
120
=
−
+
−
+
−
+
−
+
−
+
−
+
−
+
−
+
−
=
(
. )
.
(
. )
.
(
. )
.
(
. )
.
(
. )
.
(
. )
.
(
. )
.
(
. )
.
(
. )
.
. .1
χ
2
2
=
−
∑
(
)
o e
e
No
One or two More than two
piercings piercings piercings
Fat-Free Milk
47 (40.8)
33 (30.6)
22 (30.6)
102
2% Milk
40 (65.6)
80 (49.2)
44 (49.2)
164
Whole Milk
113 (52.9)
37 (70.2)
84 (70.2)
234
200
150
150
500
No
One or two More than two
piercings piercings piercings
Fat-Free Milk
47
33
22
102
2% Milk
40
80
44
164
Whole Milk
113
37
84
234
200
150
150
500
74 chi-squared test
that this work in fact dates back 200 years earlier to the
writings of mathematician Jia Xian.) Scholars of this time
routinely used the triangle to approximate nth roots of
numbers using the equivalent of the BINOMIAL THEOREM
of today. They preferred their procedural methods of
extracting square roots to solve QUADRATIC equations,
rather than make use of the general quadratic formula.
Soon after JOHN NAPIER (1550–1617) of the West
published an account of his new calculating aid, the
NAPIER’S BONES, the Chinese developed an analogous
system of graded bamboo rods that could be used to
quickly compute long multiplications and divisions. It
is not known if the Chinese invented this system independently, or whether the idea was perhaps brought to
them by 17th-century Jesuit missionaries. Along with
the ABACUS developed in China 500 years earlier, the
calculating rods allowed for improved arithmetic computations, especially useful for the precise computations needed in astronomy.
Early scholar ZU CHONGZHI (ca. 500 C.E.) computed the volume of a sphere by a principle identical to
that of BONAVENTURA CAVALIERI (1598–1647).
See also MAGIC SQUARE.
chi-squared test The chi-squared test is a statistical
test (see STATISTICS: INFERENTIAL) used to determine
whether or not two characteristics of a population are
independent or associated in some way. For example,
imagine a social study looking for a possible correlation between the type of milk people prefer on their
cereal and the number of body piercings they possess.
Five hundred people were surveyed and the results
obtained are displayed in a CONTINGENCY TABLE.
Observe, in this study, that 102/500 = 0.204 of the
participants are fat-free milk users. If milk choice
bears no relationship to body piercings, we would
expect then about 0.204 of the 200 folk with no piercings to use fat-free milk. We observed a value of 47 (the
observed frequency) but expect a value of 0.204 × 200 =
40.8 (the expected frequency). Similarly, the expected
value for fat-free milk users with more than two piercings is 0.204 × 150 = 30.6 and for whole milk users
with one or two piercings: (234/500) × 150 = 70.2. In
this way we compute all expected frequencies, here
shown in parentheses:
Denoting the observed frequencies by the letter o and
the expected frequencies by e, we compute the chisquared statistic, χ
2 , as:
where the sum is over all entries in the table. (In the
1800s it was customary to convert all differences to a
positive value by use of the squaring function rather
than the ABSOLUTE VALUE function. This way, techniques
of calculus could be readily applied—it is straightforward to differentiate the square function, for example.)
A large value for χ
2 indicates that there is considerable
discrepancy between observed and expected values, suggesting that the two features of the population are not
independent, i.e., that there is a CORRELATION. A small
χ
2 value suggests that there is no correlation.
Our particular example yields the value:
χ
2
2
2
2
2
2
2
2
2
2
47 40 8
40 8
33 30 6
30 6
22 30 6
30 6
40 65 6
65 6
80 49 2
49 2
44 49 2
49 2
113 52 9
52 9
37 70 2
70 2
84 70 2
70 2
120
=
−
+
−
+
−
+
−
+
−
+
−
+
−
+
−
+
−
=
(
. )
.
(
. )
.
(
. )
.
(
. )
.
(
. )
.
(
. )
.
(
. )
.
(
. )
.
(
. )
.
. .1
χ
2
2
=
−
∑
(
)
o e
e
No
One or two More than two
piercings piercings piercings
Fat-Free Milk
47 (40.8)
33 (30.6)
22 (30.6)
102
2% Milk
40 (65.6)
80 (49.2)
44 (49.2)
164
Whole Milk
113 (52.9)
37 (70.2)
84 (70.2)
234
200
150
150
500
No
One or two More than two
piercings piercings piercings
Fat-Free Milk
47
33
22
102
2% Milk
40
80
44
164
Whole Milk
113
37
84
234
200
150
150
500
74 chi-squared test