

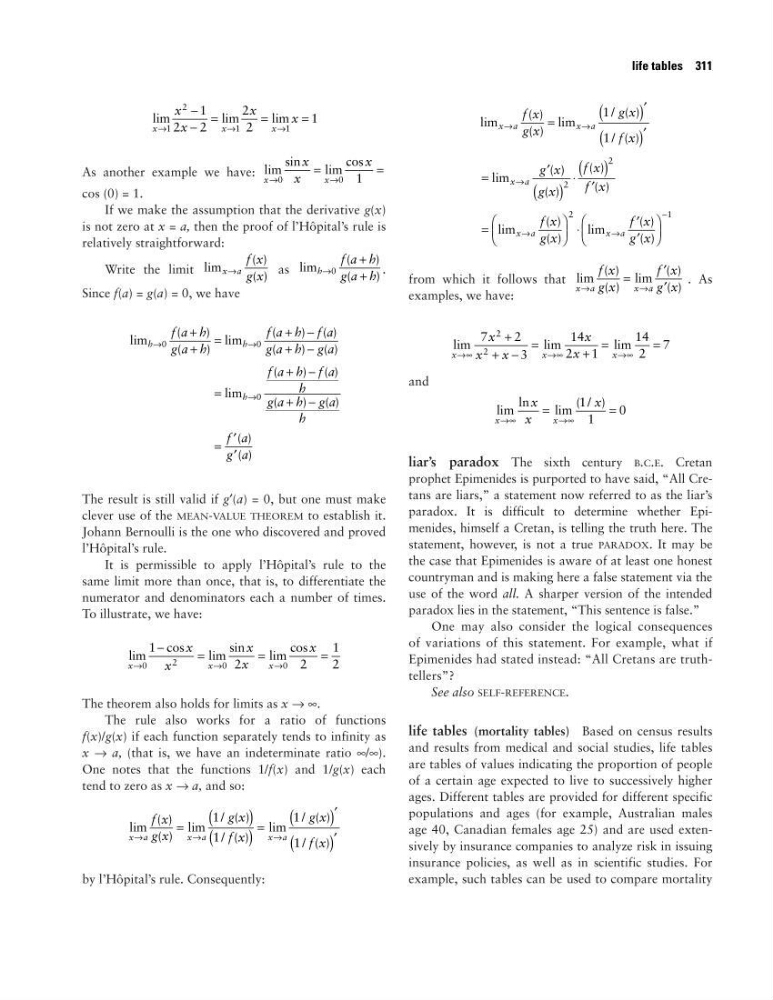
As another example we have:
cos (0) = 1.
If we make the assumption that the derivative g(x)
is not zero at x = a, then the proof of l’Hôpital’s rule is
relatively straightforward:
Write the limit
as
.
Since f(a) = g(a) = 0, we have
The result is still valid if g′(a) = 0, but one must make
clever use of the MEAN-VALUE THEOREM to establish it.
Johann Bernoulli is the one who discovered and proved
l’Hôpital’s rule.
It is permissible to apply l’Hôpital’s rule to the
same limit more than once, that is, to differentiate the
numerator and denominators each a number of times.
To illustrate, we have:
The theorem also holds for limits as x → ∞.
The rule also works for a ratio of functions
f(x)/g(x) if each function separately tends to infinity as
x → a, (that is, we have an indeterminate ratio ∞/∞).
One notes that the functions 1/f(x) and 1/g(x) each
tend to zero as x → a, and so:
by l’Hôpital’s rule. Consequently:
from which it follows that
. As
examples, we have:
and
liar’s paradox The sixth century B.C.E. Cretan
prophet Epimenides is purported to have said, “All Cretans are liars,” a statement now referred to as the liar’s
paradox. It is difficult to determine whether Epimenides, himself a Cretan, is telling the truth here. The
statement, however, is not a true PARADOX. It may be
the case that Epimenides is aware of at least one honest
countryman and is making here a false statement via the
use of the word all. A sharper version of the intended
paradox lies in the statement, “This sentence is false.”
One may also consider the logical consequences
of variations of this statement. For example, what if
Epimenides had stated instead: “All Cretans are truthtellers”?
See also SELF-REFERENCE.
life tables (mortality tables) Based on census results
and results from medical and social studies, life tables
are tables of values indicating the proportion of people
of a certain age expected to live to successively higher
ages. Different tables are provided for different specific
populations and ages (for example, Australian males
age 40, Canadian females age 25) and are used extensively by insurance companies to analyze risk in issuing
insurance policies, as well as in scientific studies. For
example, such tables can be used to compare mortality
lim
ln
lim
( / )
x
x
x
x
x
→∞
→∞
=
=
1
1
0
lim
lim
lim
x
x
x
x
x
x
x
x
→∞
→∞
→∞
+
+ −
=
+
=
=
7
2
3
14
2 1
14
2
7
2
2
lim
( )
( )
lim
( )
( )
x a
x a
f x
g x
f x
g x
→
→
=
′
′
lim
( )
( )
( )
( )
lim
( )
( )
lim
( )
( )
x a
x a
x a
g x
g x
f x
f x
f x
g x
f x
g x
→
→
→
−
=
′
( )
⋅
( )
′
=
⋅
′
′
2
2
2
1
lim
( )
( )
lim
/ ( )
/ ( )
x a
x a
f x
g x
g x
f x
→
→
=
(
)
′
(
)
′
1
1
lim
( )
( )
lim
/ ( )
/ ( )
lim
/ ( )
/ ( )
x a
x a
x a
f x
g x
g x
f x
g x
f x
→
→
→
=
(
)
(
)
=
(
)
′
(
)
′
1
1
1
1
lim
cos
lim
sin
lim
cos
x
x
x
x
x
x
x
x
→
→
→
−
=
=
=
0
2
0
0
1
2
2
1
2
lim
(
)
(
)
lim
(
) ( )
(
) ( )
lim
(
) ( )
(
) ( )
( )
( )
h
h
h
f a h
g a h
f a h f a
g a h g a
f a h f a
h
g a h g a
h
f a
g a
→
→
→
+
+
=
+ −
+ −
=
+ −
+ −
=
′
′
0
0
0
lim
(
)
(
)
h
f a h
g a h
→
+
+
0
lim
( )
( )
x a
f x
g x
→
lim
sin
lim
cos
x
x
x
x
x
→
→
=
=
0
0 1
lim
lim
lim
x
x
x
x
x
x
x
→
→
→
−
−
=
=
=
1
2
1
1
1
2
2
2
2
1
life tables 311
cos (0) = 1.
If we make the assumption that the derivative g(x)
is not zero at x = a, then the proof of l’Hôpital’s rule is
relatively straightforward:
Write the limit
as
.
Since f(a) = g(a) = 0, we have
The result is still valid if g′(a) = 0, but one must make
clever use of the MEAN-VALUE THEOREM to establish it.
Johann Bernoulli is the one who discovered and proved
l’Hôpital’s rule.
It is permissible to apply l’Hôpital’s rule to the
same limit more than once, that is, to differentiate the
numerator and denominators each a number of times.
To illustrate, we have:
The theorem also holds for limits as x → ∞.
The rule also works for a ratio of functions
f(x)/g(x) if each function separately tends to infinity as
x → a, (that is, we have an indeterminate ratio ∞/∞).
One notes that the functions 1/f(x) and 1/g(x) each
tend to zero as x → a, and so:
by l’Hôpital’s rule. Consequently:
from which it follows that
. As
examples, we have:
and
liar’s paradox The sixth century B.C.E. Cretan
prophet Epimenides is purported to have said, “All Cretans are liars,” a statement now referred to as the liar’s
paradox. It is difficult to determine whether Epimenides, himself a Cretan, is telling the truth here. The
statement, however, is not a true PARADOX. It may be
the case that Epimenides is aware of at least one honest
countryman and is making here a false statement via the
use of the word all. A sharper version of the intended
paradox lies in the statement, “This sentence is false.”
One may also consider the logical consequences
of variations of this statement. For example, what if
Epimenides had stated instead: “All Cretans are truthtellers”?
See also SELF-REFERENCE.
life tables (mortality tables) Based on census results
and results from medical and social studies, life tables
are tables of values indicating the proportion of people
of a certain age expected to live to successively higher
ages. Different tables are provided for different specific
populations and ages (for example, Australian males
age 40, Canadian females age 25) and are used extensively by insurance companies to analyze risk in issuing
insurance policies, as well as in scientific studies. For
example, such tables can be used to compare mortality
lim
ln
lim
( / )
x
x
x
x
x
→∞
→∞
=
=
1
1
0
lim
lim
lim
x
x
x
x
x
x
x
x
→∞
→∞
→∞
+
+ −
=
+
=
=
7
2
3
14
2 1
14
2
7
2
2
lim
( )
( )
lim
( )
( )
x a
x a
f x
g x
f x
g x
→
→
=
′
′
lim
( )
( )
( )
( )
lim
( )
( )
lim
( )
( )
x a
x a
x a
g x
g x
f x
f x
f x
g x
f x
g x
→
→
→
−
=
′
( )
⋅
( )
′
=
⋅
′
′
2
2
2
1
lim
( )
( )
lim
/ ( )
/ ( )
x a
x a
f x
g x
g x
f x
→
→
=
(
)
′
(
)
′
1
1
lim
( )
( )
lim
/ ( )
/ ( )
lim
/ ( )
/ ( )
x a
x a
x a
f x
g x
g x
f x
g x
f x
→
→
→
=
(
)
(
)
=
(
)
′
(
)
′
1
1
1
1
lim
cos
lim
sin
lim
cos
x
x
x
x
x
x
x
x
→
→
→
−
=
=
=
0
2
0
0
1
2
2
1
2
lim
(
)
(
)
lim
(
) ( )
(
) ( )
lim
(
) ( )
(
) ( )
( )
( )
h
h
h
f a h
g a h
f a h f a
g a h g a
f a h f a
h
g a h g a
h
f a
g a
→
→
→
+
+
=
+ −
+ −
=
+ −
+ −
=
′
′
0
0
0
lim
(
)
(
)
h
f a h
g a h
→
+
+
0
lim
( )
( )
x a
f x
g x
→
lim
sin
lim
cos
x
x
x
x
x
→
→
=
=
0
0 1
lim
lim
lim
x
x
x
x
x
x
x
→
→
→
−
−
=
=
=
1
2
1
1
1
2
2
2
2
1
life tables 311