

Safety of 5G Network Physical Infrastructures 169
However, there has been a sustained increase in the importance of environment
aspects. The problem is effectively to achieve a balance between minimising intrusion
to the environment and providing the services society has come to expect and demand.
For example, monopoles have a higher material cost but lower land cost and are more
aesthetically appealing when compared with lattice structures.
In terms of materials, traditionally hot‐rolled high strength steel is the preferred
choice. The weight of a self‐supported tower, and thus its cost, will vary approximately
with the square of the height, H. For a guyed mast, the cost will vary proportionally with
the expression H
1.5
[4,5]. In recent years, alternative materials started to be used, such
as glass‐fibre reinforced concrete (GRC) [14], in new designs or high‐modulus carbon
fibre reinforced polymer (CFRP) [15] in retrofits of existing structures. However, at the
present time, these materials still do not constitute a viable alternative solution to steel
structures.
In general, it is possible to define the following five main typologies [3]:
1) self‐supported lattice tower with a square base, generally with angle sections and
bolted connections;
2) self‐supported lattice tower with a triangular base, generally with tubular sections
and with bolted connections;
3) monopole with octagonal, dodecagonal or hexadecagonal cross‐sections, with several modules generally linked by forced fit;
4) monopole of tubular cross‐section, with several modules linked by bolted
connections;
5) lattice guyed mast with triangular or square sections.
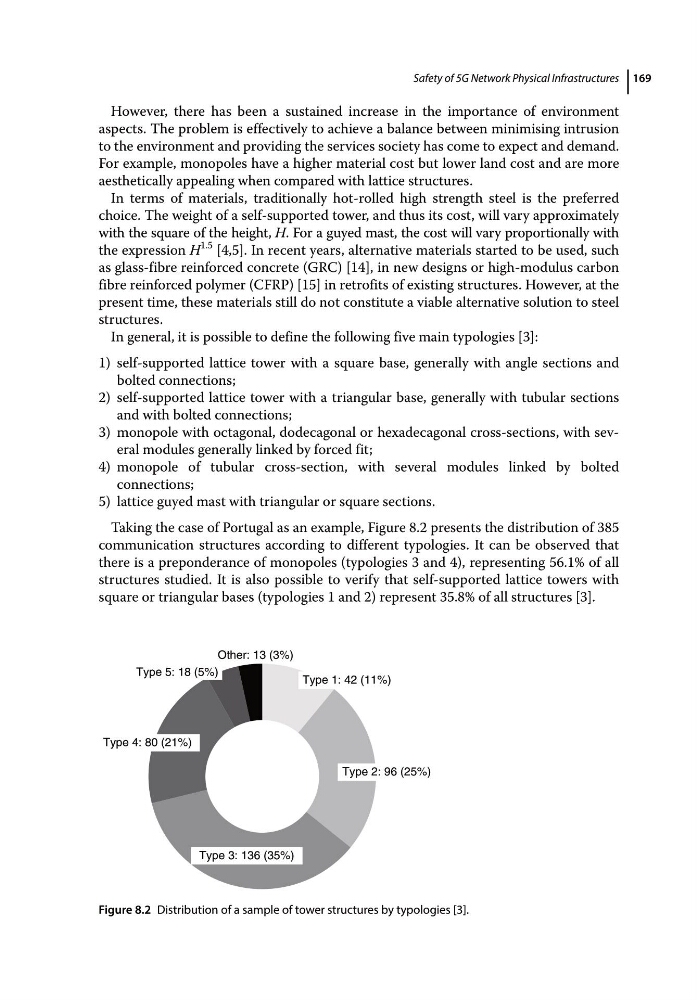
Taking the case of Portugal as an example, Figure 8.2 presents the distribution of 385
communication structures according to different typologies. It can be observed that
there is a preponderance of monopoles (typologies 3 and 4), representing 56.1% of all
structures studied. It is also possible to verify that self‐supported lattice towers with
square or triangular bases (typologies 1 and 2) represent 35.8% of all structures [3].
Type 1: 42 (11%)
Type 2: 96 (25%)
Type 3: 136 (35%)
Type 4: 80 (21%)
Type 5: 18 (5%)
Other: 13 (3%)
Figure 8.2 Distribution of a sample of tower structures by typologies [3].
However, there has been a sustained increase in the importance of environment
aspects. The problem is effectively to achieve a balance between minimising intrusion
to the environment and providing the services society has come to expect and demand.
For example, monopoles have a higher material cost but lower land cost and are more
aesthetically appealing when compared with lattice structures.
In terms of materials, traditionally hot‐rolled high strength steel is the preferred
choice. The weight of a self‐supported tower, and thus its cost, will vary approximately
with the square of the height, H. For a guyed mast, the cost will vary proportionally with
the expression H
1.5
[4,5]. In recent years, alternative materials started to be used, such
as glass‐fibre reinforced concrete (GRC) [14], in new designs or high‐modulus carbon
fibre reinforced polymer (CFRP) [15] in retrofits of existing structures. However, at the
present time, these materials still do not constitute a viable alternative solution to steel
structures.
In general, it is possible to define the following five main typologies [3]:
1) self‐supported lattice tower with a square base, generally with angle sections and
bolted connections;
2) self‐supported lattice tower with a triangular base, generally with tubular sections
and with bolted connections;
3) monopole with octagonal, dodecagonal or hexadecagonal cross‐sections, with several modules generally linked by forced fit;
4) monopole of tubular cross‐section, with several modules linked by bolted
connections;
5) lattice guyed mast with triangular or square sections.
Taking the case of Portugal as an example, Figure 8.2 presents the distribution of 385
communication structures according to different typologies. It can be observed that
there is a preponderance of monopoles (typologies 3 and 4), representing 56.1% of all
structures studied. It is also possible to verify that self‐supported lattice towers with
square or triangular bases (typologies 1 and 2) represent 35.8% of all structures [3].
Type 1: 42 (11%)
Type 2: 96 (25%)
Type 3: 136 (35%)
Type 4: 80 (21%)
Type 5: 18 (5%)
Other: 13 (3%)
Figure 8.2 Distribution of a sample of tower structures by typologies [3].