

Economic and Environmental Benefits of Cleaner Technology …
197
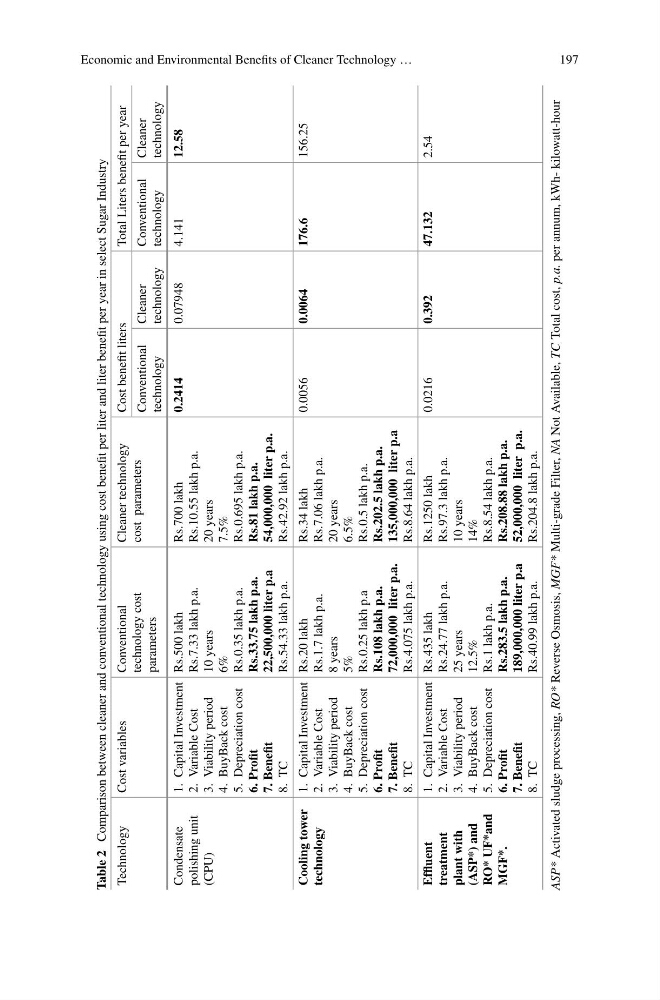
Table 2
Comparison between cleaner and conventional technology using cost benefit per liter and liter benefit per year in select Sugar Industry
Technology
Cost variables
Conventional
technology cost
parameters
Cleaner technology
cost parameters
Cost benefit liters
Total Liters benefit per year
Conventional
technology
Cleaner
technology
Conventional
technology
Cleaner
technology
Condensate
polishing unit
(CPU)
1. Capital Investment
2. Variable Cost
3. Viability period
4. BuyBack cost
5. Depreciation cost
6. Profit
7. Benefit
8. TC
Rs.500 lakh
Rs.7.33 lakh p.a.
10 years
6%
Rs.0.35 lakh p.a.
Rs.33.75 lakh p.a.
22,500,000 liter p.a
Rs.54.33 lakh p.a.
Rs.700 lakh
Rs.10.55 lakh p.a.
20 years
7.5%
Rs.0.695 lakh p.a.
Rs.81 lakh p.a.
54,000,000 liter p.a.
Rs.42.92 lakh p.a.
0.2414
0.07948
4.141
12.58
Cooling tower
technology
1. Capital Investment
2. Variable Cost
3. Viability period
4. BuyBack cost
5. Depreciation cost
6. Profit
7. Benefit
8. TC
Rs.20 lakh
Rs.1.7 lakh p.a.
8 years
5%
Rs.0.25 lakh p.a
Rs.108 lakh p.a.
72,000,000 liter p.a.
Rs.4.075 lakh p.a.
Rs.34 lakh
Rs.7.06 lakh p.a.
20 years
6.5%
Rs.0.5 lakh p.a.
Rs.202.5 lakh p.a.
135,000,000 liter p.a
Rs.8.64 lakh p.a.
0.0056
0.0064
176.6
156.25
Effluent
treatment
plant with
(ASP*) and
RO* UF*and
MGF*.
1. Capital Investment
2. Variable Cost
3. Viability period
4. BuyBack cost
5. Depreciation cost
6. Profit
7. Benefit
8. TC
Rs.435 lakh
Rs.24.77 lakh p.a.
25 years
12.5%
Rs.1 lakh p.a.
Rs.283.5 lakh p.a.
189,000,000 liter p.a
Rs.40.99 lakh p.a.
Rs.1250 lakh
Rs.97.3 lakh p.a.
10 years
14%
Rs.8.54 lakh p.a.
Rs.208.88 lakh p.a.
52,000,000 liter p.a.
Rs.204.8 lakh p.a.
0.0216
0.392
47.132
2.54
ASP*
Activated sludge processing, RO*
Reverse Osmosis, MGF*
Multi-grade Filter, NA
Not Available, TC
Total cost, p.a.
per annum, kWh- kilowatt-hour
197
Table 2
Comparison between cleaner and conventional technology using cost benefit per liter and liter benefit per year in select Sugar Industry
Technology
Cost variables
Conventional
technology cost
parameters
Cleaner technology
cost parameters
Cost benefit liters
Total Liters benefit per year
Conventional
technology
Cleaner
technology
Conventional
technology
Cleaner
technology
Condensate
polishing unit
(CPU)
1. Capital Investment
2. Variable Cost
3. Viability period
4. BuyBack cost
5. Depreciation cost
6. Profit
7. Benefit
8. TC
Rs.500 lakh
Rs.7.33 lakh p.a.
10 years
6%
Rs.0.35 lakh p.a.
Rs.33.75 lakh p.a.
22,500,000 liter p.a
Rs.54.33 lakh p.a.
Rs.700 lakh
Rs.10.55 lakh p.a.
20 years
7.5%
Rs.0.695 lakh p.a.
Rs.81 lakh p.a.
54,000,000 liter p.a.
Rs.42.92 lakh p.a.
0.2414
0.07948
4.141
12.58
Cooling tower
technology
1. Capital Investment
2. Variable Cost
3. Viability period
4. BuyBack cost
5. Depreciation cost
6. Profit
7. Benefit
8. TC
Rs.20 lakh
Rs.1.7 lakh p.a.
8 years
5%
Rs.0.25 lakh p.a
Rs.108 lakh p.a.
72,000,000 liter p.a.
Rs.4.075 lakh p.a.
Rs.34 lakh
Rs.7.06 lakh p.a.
20 years
6.5%
Rs.0.5 lakh p.a.
Rs.202.5 lakh p.a.
135,000,000 liter p.a
Rs.8.64 lakh p.a.
0.0056
0.0064
176.6
156.25
Effluent
treatment
plant with
(ASP*) and
RO* UF*and
MGF*.
1. Capital Investment
2. Variable Cost
3. Viability period
4. BuyBack cost
5. Depreciation cost
6. Profit
7. Benefit
8. TC
Rs.435 lakh
Rs.24.77 lakh p.a.
25 years
12.5%
Rs.1 lakh p.a.
Rs.283.5 lakh p.a.
189,000,000 liter p.a
Rs.40.99 lakh p.a.
Rs.1250 lakh
Rs.97.3 lakh p.a.
10 years
14%
Rs.8.54 lakh p.a.
Rs.208.88 lakh p.a.
52,000,000 liter p.a.
Rs.204.8 lakh p.a.
0.0216
0.392
47.132
2.54
ASP*
Activated sludge processing, RO*
Reverse Osmosis, MGF*
Multi-grade Filter, NA
Not Available, TC
Total cost, p.a.
per annum, kWh- kilowatt-hour