

64
differences in the local scale from anthropogenic sources may dominate (Tchounwou
et al. 2012).
Zn is an essential element that is required for biochemical and physiological
functions, but in excess amount and/or at very low content may provide a variety of
adverse effects and human diseases (Tchounwou et al. 2012). Zinc deficiency or
excessively high levels may enhance susceptibility to carcinogenesis (Choudhury
et al. 2005). One organ where zinc is prominently involved in cell death is the brain,
and cytotoxicity in consequence of ischemia or trauma involves the accumulation of
free zinc (Plum et al. 2010).
Zn content in moss samples varied in a wide range, from 10.3 mg kg
−1
to
108 mg kg
−1
, with an average concentration of 23.3 mg kg
−1
and a median of
18.4 mg kg
−1
indicating a higher population of concentration data at low values. It
is confirmed also by the value of the coefficient of the variation (CV% = 70%, moderate variation) and the values of the first and the third quartiles, Q1 = 16.2 mg kg
−1
and Q3 = 22.5 mg kg
−1
, close to the median value of the concentration data. The
spatial analysis of the Zn concentration data (linear model) (Fig. 2.18) shows an
increase in the north (Zn = 21.1 + 0.078 × n, n = 1–55). The spatial analysis of concentration data and normalized data shows higher Zn content in relatively higher
traffic areas indicating that the anthropogenic emission from traffic emission has a
local effect in Zn distribution in moss samples. Besides, the long-range transport is
an important source of Zn in Albania. By comparing the median concentrations of
Zn in 2015 (18.4 mg kg
−1
) and 2010 (13.9 mg kg
−1
) moss samples, and the equations of the respective linear models (Zn 2015 = 21.1 + 0.078 × n, n = 1–5, and
7
6
5
4
3
2
1
0
200
150
100
50
0
-50
S
1 5.5100
R-Sq
83.1%
R-Sq(adj)
82.8%
Co(N)
Ni(N)
Regression
95% CI
95% PI
Fitted Line Plot
Ni(N) = - 13.27 + 26.93 Co(N)
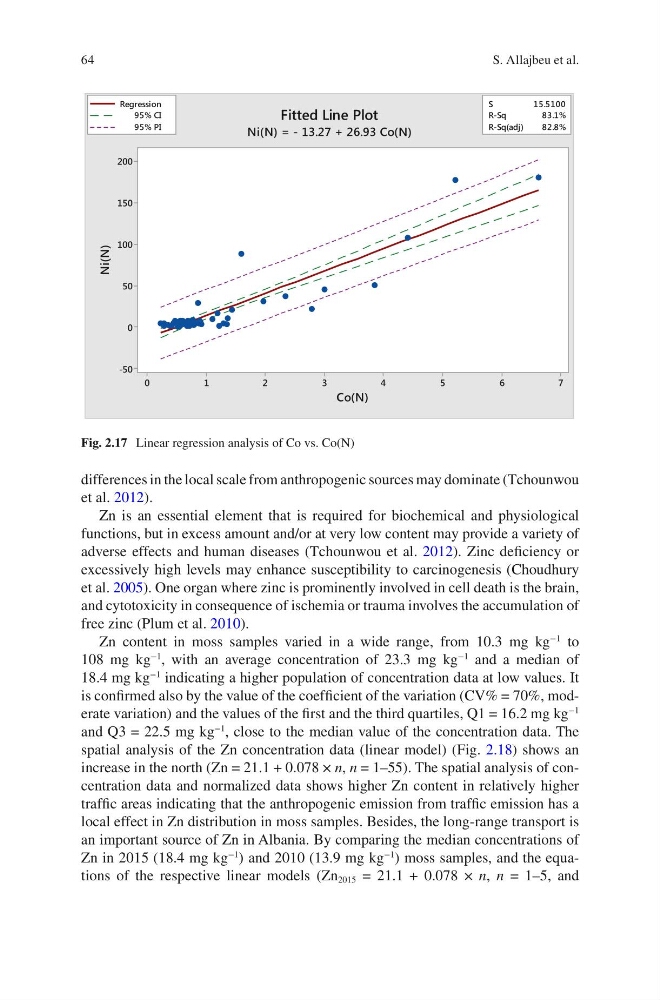
Fig. 2.17 Linear regression analysis of Co vs. Co(N)
S. Allajbeu et al.
differences in the local scale from anthropogenic sources may dominate (Tchounwou
et al. 2012).
Zn is an essential element that is required for biochemical and physiological
functions, but in excess amount and/or at very low content may provide a variety of
adverse effects and human diseases (Tchounwou et al. 2012). Zinc deficiency or
excessively high levels may enhance susceptibility to carcinogenesis (Choudhury
et al. 2005). One organ where zinc is prominently involved in cell death is the brain,
and cytotoxicity in consequence of ischemia or trauma involves the accumulation of
free zinc (Plum et al. 2010).
Zn content in moss samples varied in a wide range, from 10.3 mg kg
−1
to
108 mg kg
−1
, with an average concentration of 23.3 mg kg
−1
and a median of
18.4 mg kg
−1
indicating a higher population of concentration data at low values. It
is confirmed also by the value of the coefficient of the variation (CV% = 70%, moderate variation) and the values of the first and the third quartiles, Q1 = 16.2 mg kg
−1
and Q3 = 22.5 mg kg
−1
, close to the median value of the concentration data. The
spatial analysis of the Zn concentration data (linear model) (Fig. 2.18) shows an
increase in the north (Zn = 21.1 + 0.078 × n, n = 1–55). The spatial analysis of concentration data and normalized data shows higher Zn content in relatively higher
traffic areas indicating that the anthropogenic emission from traffic emission has a
local effect in Zn distribution in moss samples. Besides, the long-range transport is
an important source of Zn in Albania. By comparing the median concentrations of
Zn in 2015 (18.4 mg kg
−1
) and 2010 (13.9 mg kg
−1
) moss samples, and the equations of the respective linear models (Zn 2015 = 21.1 + 0.078 × n, n = 1–5, and
7
6
5
4
3
2
1
0
200
150
100
50
0
-50
S
1 5.5100
R-Sq
83.1%
R-Sq(adj)
82.8%
Co(N)
Ni(N)
Regression
95% CI
95% PI
Fitted Line Plot
Ni(N) = - 13.27 + 26.93 Co(N)
Fig. 2.17 Linear regression analysis of Co vs. Co(N)
S. Allajbeu et al.