

56
The spatial distribution plots of 2010 and 2015 moss survey of Hg concentration
data resulted totally different not only in distribution patterns but also in concentration levels. The anthropogenic emission from iron and steel metallurgy and waste
burning was evident from two outlier points with extremely high Hg content, positioned at St. 24, in Elbasan region, and St. 29, in Kruja region (Fig. 2.12c). In general, the total Hg predominately depend on the relatively stable global/hemispheric
background concentration, and only the influence from major sources may have
been resulted in higher values (Wangberg et al. 2001). Beside these two points, the
rest of the moss samples showed lower Hg content but still higher than that of 2015.
The median concentration of Hg in 2010 moss samples (0.14 mg kg
−1
) is about three
times higher than the median concentration of Hg in 2015 mosses (0.049 mg kg
−1
).
Mercury mostly exist in gaseous forms in the atmosphere, and the climatic changes
that favour Hg during dry weather of 2010 and not during wet weather of 2015
(Lazo et al. 2019, Qarri et al. 2019) could be a major factor of these differences.
Thus, the long-range transport of the pollutants can be considered as the main
source of Hg atmospheric deposition in Albania. Long-range transport has been
pointed as an important source of mercury in Europe (Harmens et al. 2015). The
anthropogenic factors such as iron and steel metallurgy, geogenic factors, transboundary pollution, crude oil and gas industry and shipping activity in the coastal
areas may result in local anomalies of Hg.
Pearson correlation analysis showed strong and significant correlation between
the Hg concentration data and Hg normalized concentration (Hg(N) data (r = 0.7,
p = 0.000) probably indicating the effect of anthropogenic sources. Hg(N) show
25
20
15
10
5
0
20
15
10
5
0
S
1 .96553
R-Sq
51.6%
R-Sq(adj)
5 0.7%
Pb(N)
Pb
Regression
95% CI
95% PI
Fitted Line Plot
Pb = 1.644 + 0.5427 Pb(N)
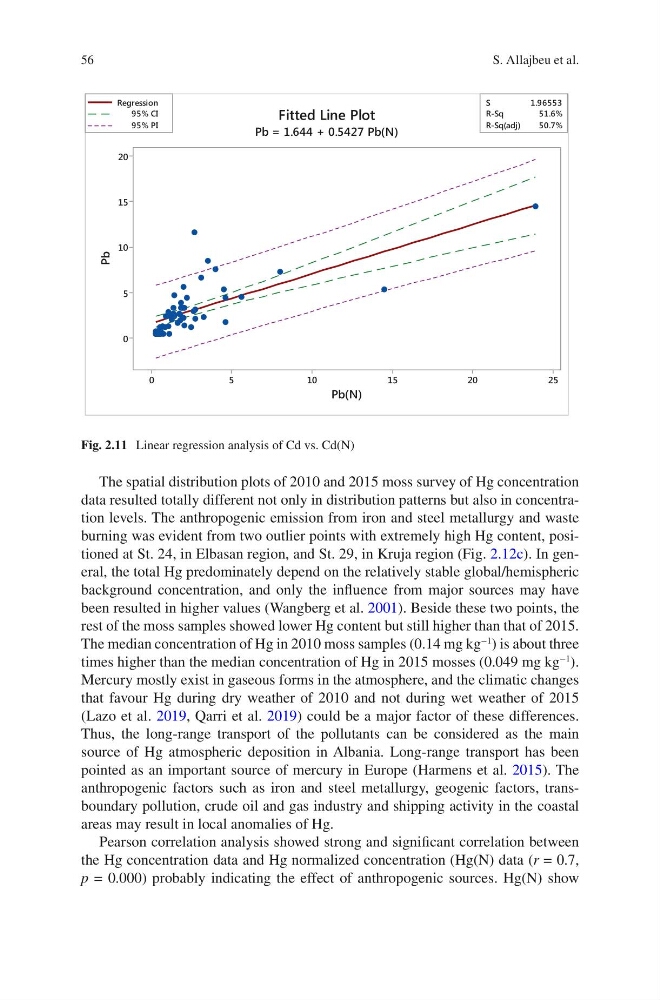
Fig. 2.11 Linear regression analysis of Cd vs. Cd(N)
S. Allajbeu et al.
The spatial distribution plots of 2010 and 2015 moss survey of Hg concentration
data resulted totally different not only in distribution patterns but also in concentration levels. The anthropogenic emission from iron and steel metallurgy and waste
burning was evident from two outlier points with extremely high Hg content, positioned at St. 24, in Elbasan region, and St. 29, in Kruja region (Fig. 2.12c). In general, the total Hg predominately depend on the relatively stable global/hemispheric
background concentration, and only the influence from major sources may have
been resulted in higher values (Wangberg et al. 2001). Beside these two points, the
rest of the moss samples showed lower Hg content but still higher than that of 2015.
The median concentration of Hg in 2010 moss samples (0.14 mg kg
−1
) is about three
times higher than the median concentration of Hg in 2015 mosses (0.049 mg kg
−1
).
Mercury mostly exist in gaseous forms in the atmosphere, and the climatic changes
that favour Hg during dry weather of 2010 and not during wet weather of 2015
(Lazo et al. 2019, Qarri et al. 2019) could be a major factor of these differences.
Thus, the long-range transport of the pollutants can be considered as the main
source of Hg atmospheric deposition in Albania. Long-range transport has been
pointed as an important source of mercury in Europe (Harmens et al. 2015). The
anthropogenic factors such as iron and steel metallurgy, geogenic factors, transboundary pollution, crude oil and gas industry and shipping activity in the coastal
areas may result in local anomalies of Hg.
Pearson correlation analysis showed strong and significant correlation between
the Hg concentration data and Hg normalized concentration (Hg(N) data (r = 0.7,
p = 0.000) probably indicating the effect of anthropogenic sources. Hg(N) show
25
20
15
10
5
0
20
15
10
5
0
S
1 .96553
R-Sq
51.6%
R-Sq(adj)
5 0.7%
Pb(N)
Pb
Regression
95% CI
95% PI
Fitted Line Plot
Pb = 1.644 + 0.5427 Pb(N)
Fig. 2.11 Linear regression analysis of Cd vs. Cd(N)
S. Allajbeu et al.