

293
H 2 O 2 (30%, m/V), were added. The Teflon vessels were carefully closed and placed
in microwave for digestion.
Barley samples were digested in two steps for total dissolving at 180 °C
(Table 10.8). After the digestion method was finished, digested samples were quantitatively transferred into 25 ml volumetric flaks.
The obtained solutions were used for chemical analysis. Concentrations of ten
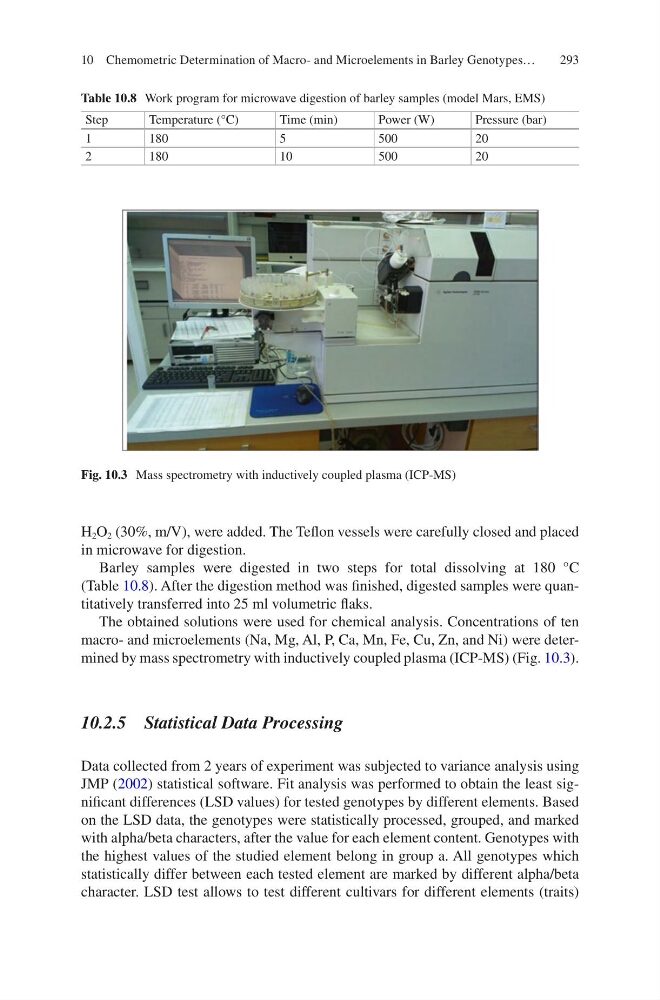
macro- and microelements (Na, Mg, Al, P, Ca, Mn, Fe, Cu, Zn, and Ni) were determined by mass spectrometry with inductively coupled plasma (ICP-MS) (Fig. 10.3).
10.2.5 Statistical Data Processing
Data collected from 2 years of experiment was subjected to variance analysis using
JMP (2002) statistical software. Fit analysis was performed to obtain the least significant differences (LSD values) for tested genotypes by different elements. Based
on the LSD data, the genotypes were statistically processed, grouped, and marked
with alpha/beta characters, after the value for each element content. Genotypes with
the highest values of the studied element belong in group a. All genotypes which
statistically differ between each tested element are marked by different alpha/beta
character. LSD test allows to test different cultivars for different elements (traits)
Table 10.8 Work program for microwave digestion of barley samples (model Mars, EMS)
Step
Temperature (°C)
Time (min)
Power (W)
Pressure (bar)
1
180
5
500
20
2
180
10
500
20
Fig. 10.3 Mass spectrometry with inductively coupled plasma (ICP-МS)
10 Chemometric Determination of Macro- and Microelements in Barley Genotypes…
H 2 O 2 (30%, m/V), were added. The Teflon vessels were carefully closed and placed
in microwave for digestion.
Barley samples were digested in two steps for total dissolving at 180 °C
(Table 10.8). After the digestion method was finished, digested samples were quantitatively transferred into 25 ml volumetric flaks.
The obtained solutions were used for chemical analysis. Concentrations of ten
macro- and microelements (Na, Mg, Al, P, Ca, Mn, Fe, Cu, Zn, and Ni) were determined by mass spectrometry with inductively coupled plasma (ICP-MS) (Fig. 10.3).
10.2.5 Statistical Data Processing
Data collected from 2 years of experiment was subjected to variance analysis using
JMP (2002) statistical software. Fit analysis was performed to obtain the least significant differences (LSD values) for tested genotypes by different elements. Based
on the LSD data, the genotypes were statistically processed, grouped, and marked
with alpha/beta characters, after the value for each element content. Genotypes with
the highest values of the studied element belong in group a. All genotypes which
statistically differ between each tested element are marked by different alpha/beta
character. LSD test allows to test different cultivars for different elements (traits)
Table 10.8 Work program for microwave digestion of barley samples (model Mars, EMS)
Step
Temperature (°C)
Time (min)
Power (W)
Pressure (bar)
1
180
5
500
20
2
180
10
500
20
Fig. 10.3 Mass spectrometry with inductively coupled plasma (ICP-МS)
10 Chemometric Determination of Macro- and Microelements in Barley Genotypes…