

251
usually occurring with iron. Mn can be found as a component of over 100 minerals.
In nature, it is not found in its pure (elemental) form (ATSDR 2000). It is a significant constituent of basalt and many olivines, pyroxene, and amphibole. Divalent
manganese is a minor constituent in many igneous and metamorphic rocks. Small
amounts of divalent magnesium may substitute calcium in dolomite and limestone.
In groundwater and other natural waters, Mn
2+
is a predominant oxidation state and
is more stable toward oxidation than the ferrous iron. Mn
3+
and Mn
4+
are not likely
to occur. Mn
3+
is unstable except in strongly acidic solutions, and Mn
4+
could theoretically occur only at very high pH. In aquatic systems where HCO 3
−
is present in
high concentrations, MnHCO 3
+
will be the predominant form (Hem 1963).
Manganese concentrations in the investigated groundwater ranged between less
than 0.5 μg/l and 3329 μg/l with a median value of 259.76 μg/l. Welch’s t-test and
power analysis showed that investigated samples from shallow and deep groundwater significantly defer regarding Mn concentrations with median values of 20.8 μg/l
and 371 μg/l, respectively. Approximately 45% of shallow and 94% of deep groundwater samples show concentrations greater than the levels of public health concern
of 0.05 mg/l. The maximum concentration in shallow groundwater was 3.3 mg/l and
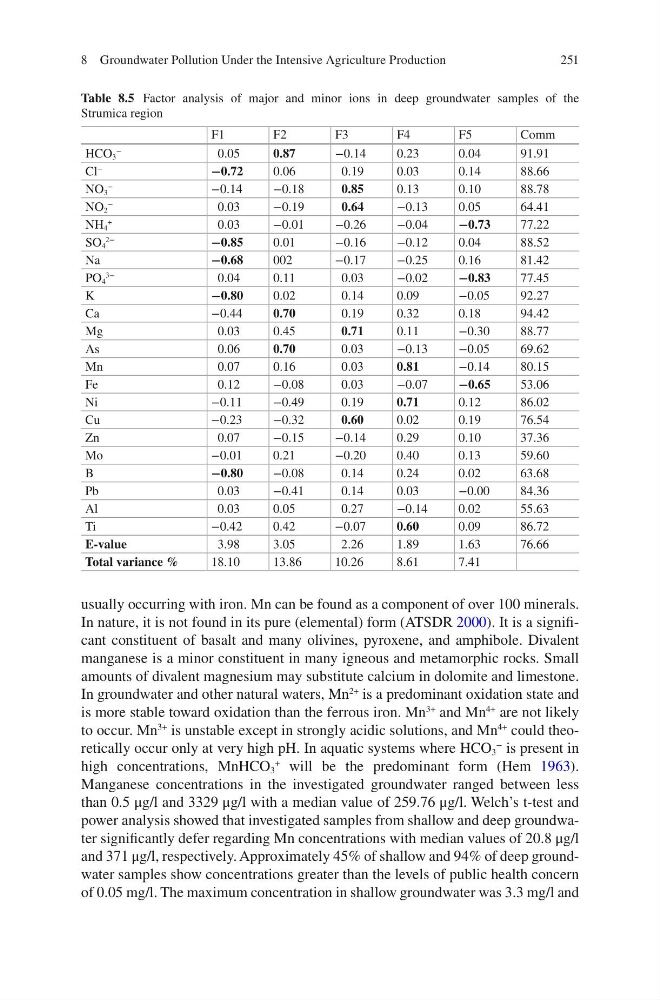
Table 8.5 Factor analysis of major and minor ions in deep groundwater samples of the
Strumica region
F1
F2
F3
F4
F5
Comm
HCO 3
−
0.05
0.87
−0.14
0.23
0.04
91.91
Cl
−
−0.72
0.06
0.19
0.03
0.14
88.66
NO 3
−
−0.14
−0.18
0.85
0.13
0.10
88.78
NO 2
−
0.03
−0.19
0.64
−0.13
0.05
64.41
NH 4
+
0.03
−0.01
−0.26
−0.04
−0.73
77.22
SO 4
2−
−0.85
0.01
−0.16
−0.12
0.04
88.52
Na
−0.68
002
−0.17
−0.25
0.16
81.42
PO 4
3−
0.04
0.11
0.03
−0.02
−0.83
77.45
K
−0.80
0.02
0.14
0.09
−0.05
92.27
Ca
−0.44
0.70
0.19
0.32
0.18
94.42
Mg
0.03
0.45
0.71
0.11
−0.30
88.77
As
0.06
0.70
0.03
−0.13
−0.05
69.62
Mn
0.07
0.16
0.03
0.81
−0.14
80.15
Fe
0.12
−0.08
0.03
−0.07
−0.65
53.06
Ni
−0.11
−0.49
0.19
0.71
0.12
86.02
Cu
−0.23
−0.32
0.60
0.02
0.19
76.54
Zn
0.07
−0.15
−0.14
0.29
0.10
37.36
Mo
−0.01
0.21
−0.20
0.40
0.13
59.60
B
−0.80
−0.08
0.14
0.24
0.02
63.68
Pb
0.03
−0.41
0.14
0.03
−0.00
84.36
Al
0.03
0.05
0.27
−0.14
0.02
55.63
Ti
−0.42
0.42
−0.07
0.60
0.09
86.72
E-value
3.98
3.05
2.26
1.89
1.63
76.66
Total variance %
18.10
13.86
10.26
8.61
7.41
8 Groundwater Pollution Under the Intensive Agriculture Production
usually occurring with iron. Mn can be found as a component of over 100 minerals.
In nature, it is not found in its pure (elemental) form (ATSDR 2000). It is a significant constituent of basalt and many olivines, pyroxene, and amphibole. Divalent
manganese is a minor constituent in many igneous and metamorphic rocks. Small
amounts of divalent magnesium may substitute calcium in dolomite and limestone.
In groundwater and other natural waters, Mn
2+
is a predominant oxidation state and
is more stable toward oxidation than the ferrous iron. Mn
3+
and Mn
4+
are not likely
to occur. Mn
3+
is unstable except in strongly acidic solutions, and Mn
4+
could theoretically occur only at very high pH. In aquatic systems where HCO 3
−
is present in
high concentrations, MnHCO 3
+
will be the predominant form (Hem 1963).
Manganese concentrations in the investigated groundwater ranged between less
than 0.5 μg/l and 3329 μg/l with a median value of 259.76 μg/l. Welch’s t-test and
power analysis showed that investigated samples from shallow and deep groundwater significantly defer regarding Mn concentrations with median values of 20.8 μg/l
and 371 μg/l, respectively. Approximately 45% of shallow and 94% of deep groundwater samples show concentrations greater than the levels of public health concern
of 0.05 mg/l. The maximum concentration in shallow groundwater was 3.3 mg/l and
Table 8.5 Factor analysis of major and minor ions in deep groundwater samples of the
Strumica region
F1
F2
F3
F4
F5
Comm
HCO 3
−
0.05
0.87
−0.14
0.23
0.04
91.91
Cl
−
−0.72
0.06
0.19
0.03
0.14
88.66
NO 3
−
−0.14
−0.18
0.85
0.13
0.10
88.78
NO 2
−
0.03
−0.19
0.64
−0.13
0.05
64.41
NH 4
+
0.03
−0.01
−0.26
−0.04
−0.73
77.22
SO 4
2−
−0.85
0.01
−0.16
−0.12
0.04
88.52
Na
−0.68
002
−0.17
−0.25
0.16
81.42
PO 4
3−
0.04
0.11
0.03
−0.02
−0.83
77.45
K
−0.80
0.02
0.14
0.09
−0.05
92.27
Ca
−0.44
0.70
0.19
0.32
0.18
94.42
Mg
0.03
0.45
0.71
0.11
−0.30
88.77
As
0.06
0.70
0.03
−0.13
−0.05
69.62
Mn
0.07
0.16
0.03
0.81
−0.14
80.15
Fe
0.12
−0.08
0.03
−0.07
−0.65
53.06
Ni
−0.11
−0.49
0.19
0.71
0.12
86.02
Cu
−0.23
−0.32
0.60
0.02
0.19
76.54
Zn
0.07
−0.15
−0.14
0.29
0.10
37.36
Mo
−0.01
0.21
−0.20
0.40
0.13
59.60
B
−0.80
−0.08
0.14
0.24
0.02
63.68
Pb
0.03
−0.41
0.14
0.03
−0.00
84.36
Al
0.03
0.05
0.27
−0.14
0.02
55.63
Ti
−0.42
0.42
−0.07
0.60
0.09
86.72
E-value
3.98
3.05
2.26
1.89
1.63
76.66
Total variance %
18.10
13.86
10.26
8.61
7.41
8 Groundwater Pollution Under the Intensive Agriculture Production