

249
et al. 1989; Lord and Anthony 2002; Schroeder et al. 2004; Burkart and Stoner
2007). According to Durfor and Becker (1964), the concentration of nitrate in
groundwater may be as much as 1000 mg/l in highly polluted groundwater, but
generally, it is found to be less than 50 mg/l. One of the most dominant natural processes that can contribute to reducing nitrate concentrations in groundwater is the
process of denitrification. According to Firestone (1982), denitrification most readily occurs above 10 °C and in the presence of electron donors. The process begins
with a reduction of NO 3
−
to NO 2
−
, followed by the reduction of NO 2
−
to NO
−
, and
finally reduction to N 2 O or N 2 gases which escapes from groundwater (Rivett
et al. 2008).
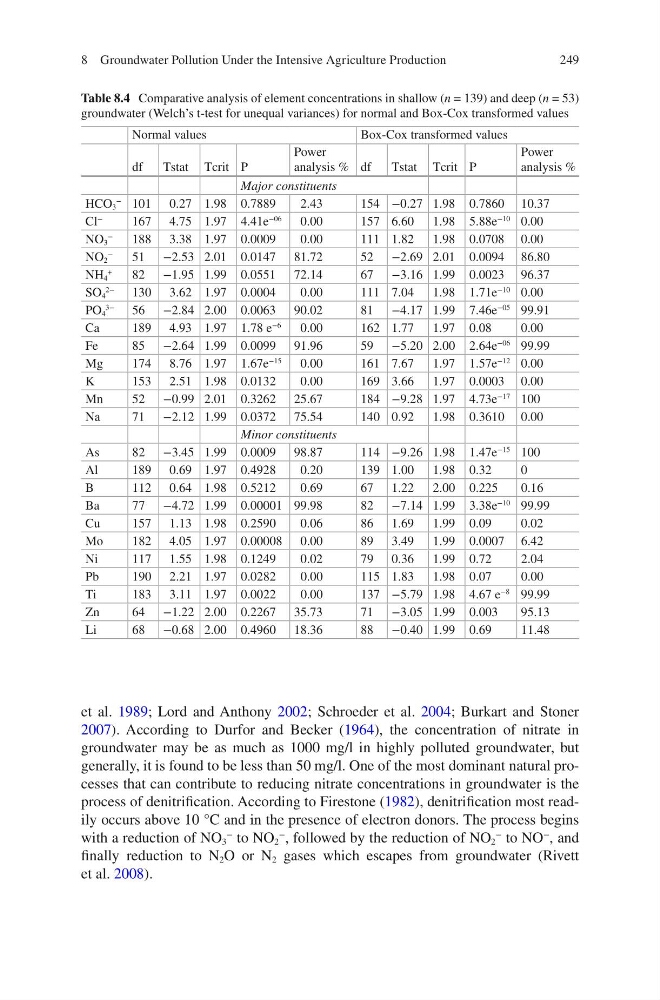
Table 8.4 Comparative analysis of element concentrations in shallow (n = 139) and deep (n = 53)
groundwater (Welch’s t-test for unequal variances) for normal and Box-Cox transformed values
Normal values
Box-Cox transformed values
df
Tstat Tcrit P
Power
analysis % df
Tstat Tcrit P
Power
analysis %
Major constituents
HCO 3
− 101 0.27 1.98 0.7889
2.43
154 −0.27 1.98 0.7860 10.37
Cl
−
167 4.75 1.97 4.41e
−06
0.00
157 6.60 1.98 5.88e
−10 0.00
NO 3
−
188 3.38 1.97 0.0009
0.00
111 1.82 1.98 0.0708 0.00
NO 2
−
51 −2.53 2.01 0.0147 81.72
52 −2.69 2.01 0.0094 86.80
NH 4
+
82 −1.95 1.99 0.0551 72.14
67 −3.16 1.99 0.0023 96.37
SO 4
2−
130 3.62 1.97 0.0004
0.00
111 7.04 1.98 1.71e
−10 0.00
PO 4
3−
56 −2.84 2.00 0.0063 90.02
81 −4.17 1.99 7.46e
−05 99.91
Ca
189 4.93 1.97 1.78 e
−6
0.00
162 1.77 1.97 0.08
0.00
Fe
85 −2.64 1.99 0.0099 91.96
59 −5.20 2.00 2.64e
−06 99.99
Mg
174 8.76 1.97 1.67e
−15
0.00
161 7.67 1.97 1.57e
−12 0.00
K
153 2.51 1.98 0.0132
0.00
169 3.66 1.97 0.0003 0.00
Mn
52 −0.99 2.01 0.3262 25.67
184 −9.28 1.97 4.73e
−17 100
Na
71 −2.12 1.99 0.0372 75.54
140 0.92 1.98 0.3610 0.00
Minor constituents
As
82 −3.45 1.99 0.0009 98.87
114 −9.26 1.98 1.47e
−15 100
Al
189 0.69 1.97 0.4928
0.20
139 1.00 1.98 0.32
0
B
112 0.64 1.98 0.5212
0.69
67 1.22 2.00 0.225
0.16
Ba
77 −4.72 1.99 0.00001 99.98
82 −7.14 1.99 3.38e
−10 99.99
Cu
157 1.13 1.98 0.2590
0.06
86 1.69 1.99 0.09
0.02
Mo
182 4.05 1.97 0.00008 0.00
89 3.49 1.99 0.0007 6.42
Ni
117 1.55 1.98 0.1249
0.02
79 0.36 1.99 0.72
2.04
Pb
190 2.21 1.97 0.0282
0.00
115 1.83 1.98 0.07
0.00
Ti
183 3.11 1.97 0.0022
0.00
137 −5.79 1.98 4.67 e
−8 99.99
Zn
64 −1.22 2.00 0.2267 35.73
71 −3.05 1.99 0.003
95.13
Li
68 −0.68 2.00 0.4960 18.36
88 −0.40 1.99 0.69
11.48
8 Groundwater Pollution Under the Intensive Agriculture Production
et al. 1989; Lord and Anthony 2002; Schroeder et al. 2004; Burkart and Stoner
2007). According to Durfor and Becker (1964), the concentration of nitrate in
groundwater may be as much as 1000 mg/l in highly polluted groundwater, but
generally, it is found to be less than 50 mg/l. One of the most dominant natural processes that can contribute to reducing nitrate concentrations in groundwater is the
process of denitrification. According to Firestone (1982), denitrification most readily occurs above 10 °C and in the presence of electron donors. The process begins
with a reduction of NO 3
−
to NO 2
−
, followed by the reduction of NO 2
−
to NO
−
, and
finally reduction to N 2 O or N 2 gases which escapes from groundwater (Rivett
et al. 2008).
Table 8.4 Comparative analysis of element concentrations in shallow (n = 139) and deep (n = 53)
groundwater (Welch’s t-test for unequal variances) for normal and Box-Cox transformed values
Normal values
Box-Cox transformed values
df
Tstat Tcrit P
Power
analysis % df
Tstat Tcrit P
Power
analysis %
Major constituents
HCO 3
− 101 0.27 1.98 0.7889
2.43
154 −0.27 1.98 0.7860 10.37
Cl
−
167 4.75 1.97 4.41e
−06
0.00
157 6.60 1.98 5.88e
−10 0.00
NO 3
−
188 3.38 1.97 0.0009
0.00
111 1.82 1.98 0.0708 0.00
NO 2
−
51 −2.53 2.01 0.0147 81.72
52 −2.69 2.01 0.0094 86.80
NH 4
+
82 −1.95 1.99 0.0551 72.14
67 −3.16 1.99 0.0023 96.37
SO 4
2−
130 3.62 1.97 0.0004
0.00
111 7.04 1.98 1.71e
−10 0.00
PO 4
3−
56 −2.84 2.00 0.0063 90.02
81 −4.17 1.99 7.46e
−05 99.91
Ca
189 4.93 1.97 1.78 e
−6
0.00
162 1.77 1.97 0.08
0.00
Fe
85 −2.64 1.99 0.0099 91.96
59 −5.20 2.00 2.64e
−06 99.99
Mg
174 8.76 1.97 1.67e
−15
0.00
161 7.67 1.97 1.57e
−12 0.00
K
153 2.51 1.98 0.0132
0.00
169 3.66 1.97 0.0003 0.00
Mn
52 −0.99 2.01 0.3262 25.67
184 −9.28 1.97 4.73e
−17 100
Na
71 −2.12 1.99 0.0372 75.54
140 0.92 1.98 0.3610 0.00
Minor constituents
As
82 −3.45 1.99 0.0009 98.87
114 −9.26 1.98 1.47e
−15 100
Al
189 0.69 1.97 0.4928
0.20
139 1.00 1.98 0.32
0
B
112 0.64 1.98 0.5212
0.69
67 1.22 2.00 0.225
0.16
Ba
77 −4.72 1.99 0.00001 99.98
82 −7.14 1.99 3.38e
−10 99.99
Cu
157 1.13 1.98 0.2590
0.06
86 1.69 1.99 0.09
0.02
Mo
182 4.05 1.97 0.00008 0.00
89 3.49 1.99 0.0007 6.42
Ni
117 1.55 1.98 0.1249
0.02
79 0.36 1.99 0.72
2.04
Pb
190 2.21 1.97 0.0282
0.00
115 1.83 1.98 0.07
0.00
Ti
183 3.11 1.97 0.0022
0.00
137 −5.79 1.98 4.67 e
−8 99.99
Zn
64 −1.22 2.00 0.2267 35.73
71 −3.05 1.99 0.003
95.13
Li
68 −0.68 2.00 0.4960 18.36
88 −0.40 1.99 0.69
11.48
8 Groundwater Pollution Under the Intensive Agriculture Production