

233
7.4 Conclusion
Liquid-liquid extraction with low amount of dichloromethane followed by the concentration of the sample of 10,000 times and increased pressure injection in the
range of 10–50 psi for vent time of 0.5 and 1.5 min was investigated in this study for
9 thermally labile nonvolatile (benalaxyl, buprofezin, chlorpyrifos, malathion,
methomyl, metribuzin, pirimiphos methyl, pyrimethanil, and triadimenol) and two
thermally stable, nonvolatile pesticides (penconazole and pirimicarb). The result
showed that the pressure of 50 psi significantly improves the peak response of the
investigated pesticides and decreases the level of decomposition of the thermally
labile pesticides. No statistically significant influence was observed regarding the
duration of the vent time, and no significant interaction exists between the vent time
and the pulse pressure. Two-factorial ANOVA followed by the post hoc Turkey test
can be a useful tool in distinguishing statistically significant differences between the
improvements in different method performances in instrumental analysis.
Acceptable recovery can be obtained even if lower amounts of DCM like 40 ml is
added in portions during the process of pesticide extraction like pyrimethanil, pirimicarb, pirimiphos methyl, chlorpyrifos, triadimenol, buprofezin, and benalaxyl
from groundwater. If no significant groundwater pollution is observed, extracts
from groundwater can be concentrated up to 10,000 times to lower the detection
limits. The negative side of this is the need of highly competent and skilled staff.
Pyrimethanil and chlorpyrifos were detected in maximum concentration of 0.3392
and 0.0367 μg/l, respectively. The obtained result indicates that pyrimethanil is
likely to be found in the groundwater under the agriculture area where it is applied
if deposits like alluvial sediment sands, gravels, clays, and sandy clays are present.
Despite its low toxicity, it should be considered as a potential groundwater contaminant and included in the multi-residual methods more often since it can disturb the
natural balance of the groundwater.
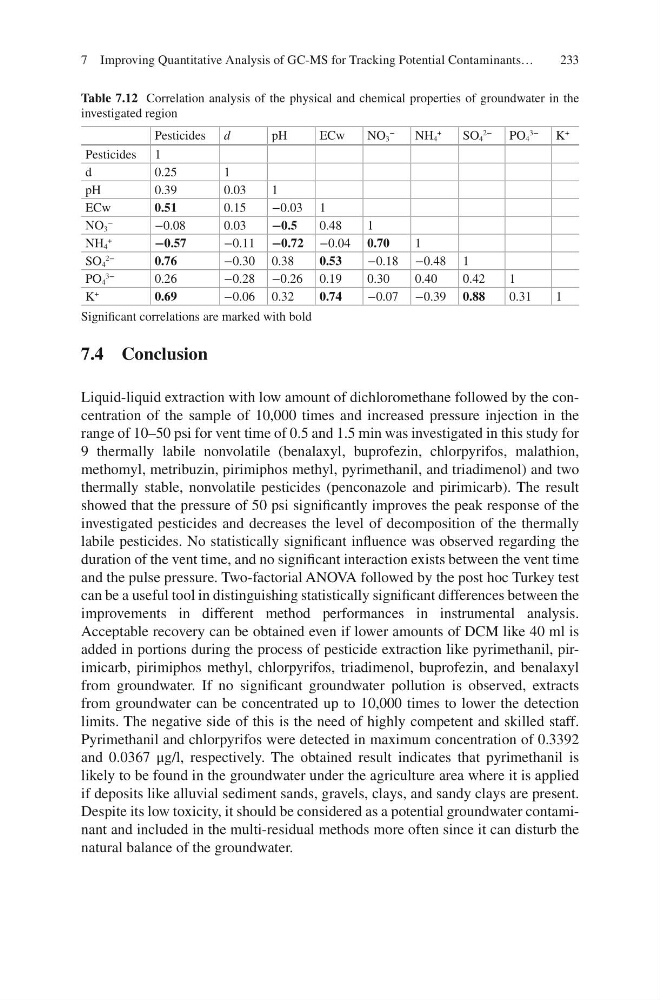
Table 7.12 Correlation analysis of the physical and chemical properties of groundwater in the
investigated region
Pesticides d
pH
ECw
NO 3
−
NH 4
+
SO 4
2−
PO 4
3−
K
+
Pesticides 1
d
0.25
1
pH
0.39
0.03
1
ECw
0.51
0.15
−0.03 1
NO 3
−
−0.08
0.03
−0.5
0.48
1
NH 4
+
−0.57
−0.11 −0.72 −0.04 0.70
1
SO 4
2−
0.76
−0.30 0.38
0.53
−0.18 −0.48 1
PO 4
3−
0.26
−0.28 −0.26 0.19
0.30
0.40
0.42
1
K
+
0.69
−0.06 0.32
0.74
−0.07 −0.39 0.88
0.31
1
Significant correlations are marked with bold
7 Improving Quantitative Analysis of GC-MS for Tracking Potential Contaminants…
7.4 Conclusion
Liquid-liquid extraction with low amount of dichloromethane followed by the concentration of the sample of 10,000 times and increased pressure injection in the
range of 10–50 psi for vent time of 0.5 and 1.5 min was investigated in this study for
9 thermally labile nonvolatile (benalaxyl, buprofezin, chlorpyrifos, malathion,
methomyl, metribuzin, pirimiphos methyl, pyrimethanil, and triadimenol) and two
thermally stable, nonvolatile pesticides (penconazole and pirimicarb). The result
showed that the pressure of 50 psi significantly improves the peak response of the
investigated pesticides and decreases the level of decomposition of the thermally
labile pesticides. No statistically significant influence was observed regarding the
duration of the vent time, and no significant interaction exists between the vent time
and the pulse pressure. Two-factorial ANOVA followed by the post hoc Turkey test
can be a useful tool in distinguishing statistically significant differences between the
improvements in different method performances in instrumental analysis.
Acceptable recovery can be obtained even if lower amounts of DCM like 40 ml is
added in portions during the process of pesticide extraction like pyrimethanil, pirimicarb, pirimiphos methyl, chlorpyrifos, triadimenol, buprofezin, and benalaxyl
from groundwater. If no significant groundwater pollution is observed, extracts
from groundwater can be concentrated up to 10,000 times to lower the detection
limits. The negative side of this is the need of highly competent and skilled staff.
Pyrimethanil and chlorpyrifos were detected in maximum concentration of 0.3392
and 0.0367 μg/l, respectively. The obtained result indicates that pyrimethanil is
likely to be found in the groundwater under the agriculture area where it is applied
if deposits like alluvial sediment sands, gravels, clays, and sandy clays are present.
Despite its low toxicity, it should be considered as a potential groundwater contaminant and included in the multi-residual methods more often since it can disturb the
natural balance of the groundwater.
Table 7.12 Correlation analysis of the physical and chemical properties of groundwater in the
investigated region
Pesticides d
pH
ECw
NO 3
−
NH 4
+
SO 4
2−
PO 4
3−
K
+
Pesticides 1
d
0.25
1
pH
0.39
0.03
1
ECw
0.51
0.15
−0.03 1
NO 3
−
−0.08
0.03
−0.5
0.48
1
NH 4
+
−0.57
−0.11 −0.72 −0.04 0.70
1
SO 4
2−
0.76
−0.30 0.38
0.53
−0.18 −0.48 1
PO 4
3−
0.26
−0.28 −0.26 0.19
0.30
0.40
0.42
1
K
+
0.69
−0.06 0.32
0.74
−0.07 −0.39 0.88
0.31
1
Significant correlations are marked with bold
7 Improving Quantitative Analysis of GC-MS for Tracking Potential Contaminants…