

163
elements that are not of interest. This occurs when the energy difference between
the elements not of interest and elements of interest is equal to the energy resolution
of the spectrometer. Figures below present X-ray mapping of both moss species.
The resolution of X-ray mapping is limited by “analysis area.” But even when a
particle smaller than the analysis area is present on the specimen surface, sometimes
this particle can be recognized. On the other hand, a method that quantitatively
analyzes the specimen one by one while scanning the electron probe is called “quantitative mapping.” Using this method, even if the P-B ratio is low, accurate
distribution of elements can be obtained. This is an advantage of quantitative mapping, which cannot be achieved using simple X-ray mapping (qualitative mapping).
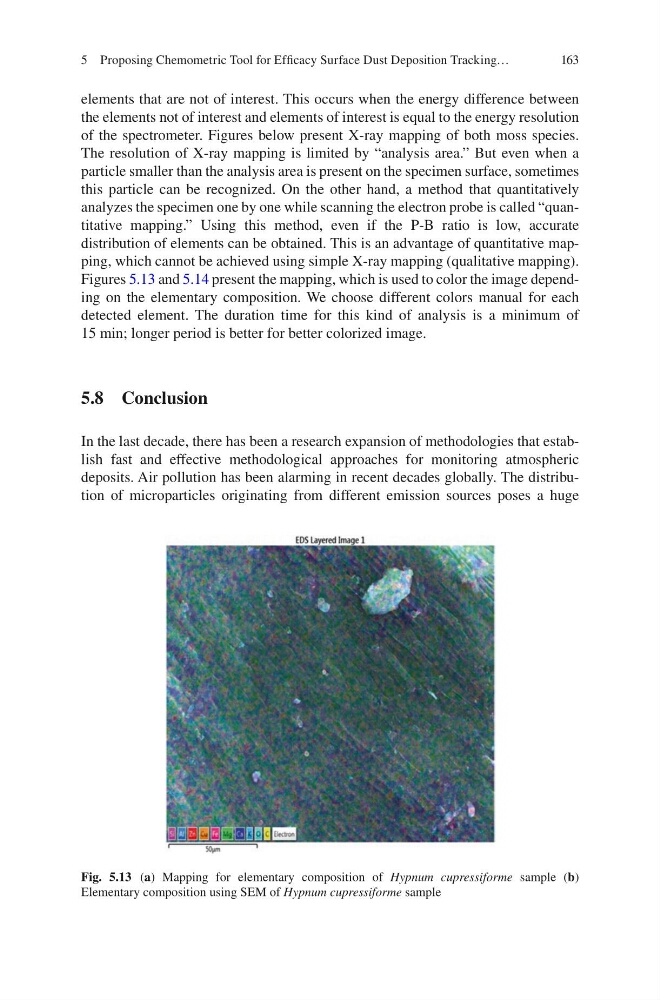
Figures 5.13 and 5.14 present the mapping, which is used to color the image depending on the elementary composition. We choose different colors manual for each
detected element. The duration time for this kind of analysis is a minimum of
15 min; longer period is better for better colorized image.
5.8 Conclusion
In the last decade, there has been a research expansion of methodologies that establish fast and effective methodological approaches for monitoring atmospheric
deposits. Air pollution has been alarming in recent decades globally. The distribution of microparticles originating from different emission sources poses a huge
Fig. 5.13 (a) Mapping for elementary composition of Hypnum cupressiforme sample (b)
Elementary composition using SEM of Hypnum cupressiforme sample
5 Proposing Chemometric Tool for Efficacy Surface Dust Deposition Tracking…
elements that are not of interest. This occurs when the energy difference between
the elements not of interest and elements of interest is equal to the energy resolution
of the spectrometer. Figures below present X-ray mapping of both moss species.
The resolution of X-ray mapping is limited by “analysis area.” But even when a
particle smaller than the analysis area is present on the specimen surface, sometimes
this particle can be recognized. On the other hand, a method that quantitatively
analyzes the specimen one by one while scanning the electron probe is called “quantitative mapping.” Using this method, even if the P-B ratio is low, accurate
distribution of elements can be obtained. This is an advantage of quantitative mapping, which cannot be achieved using simple X-ray mapping (qualitative mapping).
Figures 5.13 and 5.14 present the mapping, which is used to color the image depending on the elementary composition. We choose different colors manual for each
detected element. The duration time for this kind of analysis is a minimum of
15 min; longer period is better for better colorized image.
5.8 Conclusion
In the last decade, there has been a research expansion of methodologies that establish fast and effective methodological approaches for monitoring atmospheric
deposits. Air pollution has been alarming in recent decades globally. The distribution of microparticles originating from different emission sources poses a huge
Fig. 5.13 (a) Mapping for elementary composition of Hypnum cupressiforme sample (b)
Elementary composition using SEM of Hypnum cupressiforme sample
5 Proposing Chemometric Tool for Efficacy Surface Dust Deposition Tracking…