

161
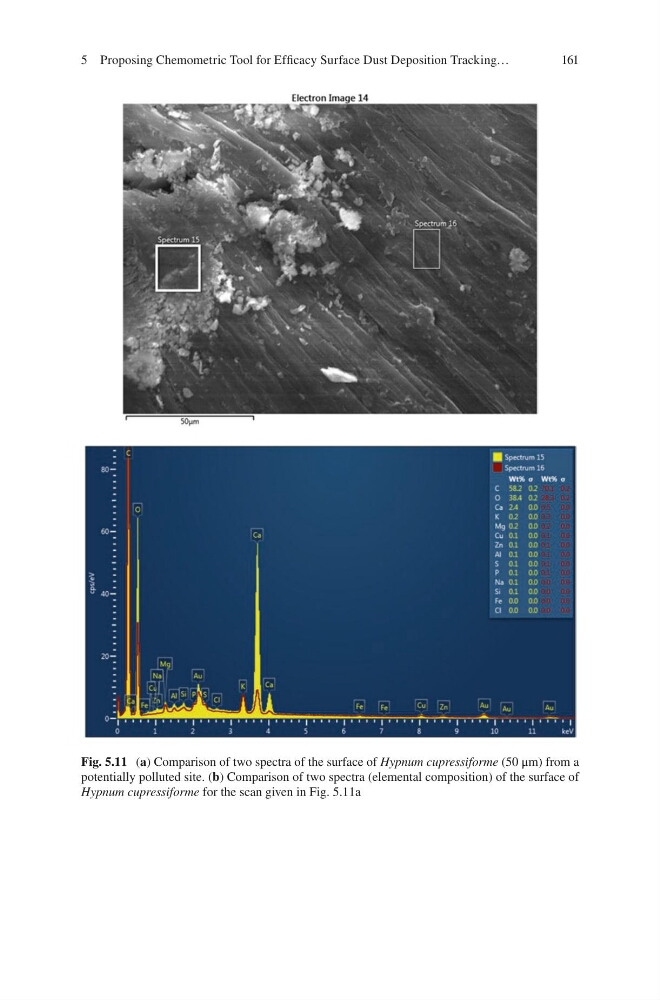
Fig. 5.11 (a) Comparison of two spectra of the surface of Hypnum cupressiforme (50 μm) from a
potentially polluted site. (b) Comparison of two spectra (elemental composition) of the surface of
Hypnum cupressiforme for the scan given in Fig. 5.11a
5 Proposing Chemometric Tool for Efficacy Surface Dust Deposition Tracking…
Fig. 5.11 (a) Comparison of two spectra of the surface of Hypnum cupressiforme (50 μm) from a
potentially polluted site. (b) Comparison of two spectra (elemental composition) of the surface of
Hypnum cupressiforme for the scan given in Fig. 5.11a
5 Proposing Chemometric Tool for Efficacy Surface Dust Deposition Tracking…