

86
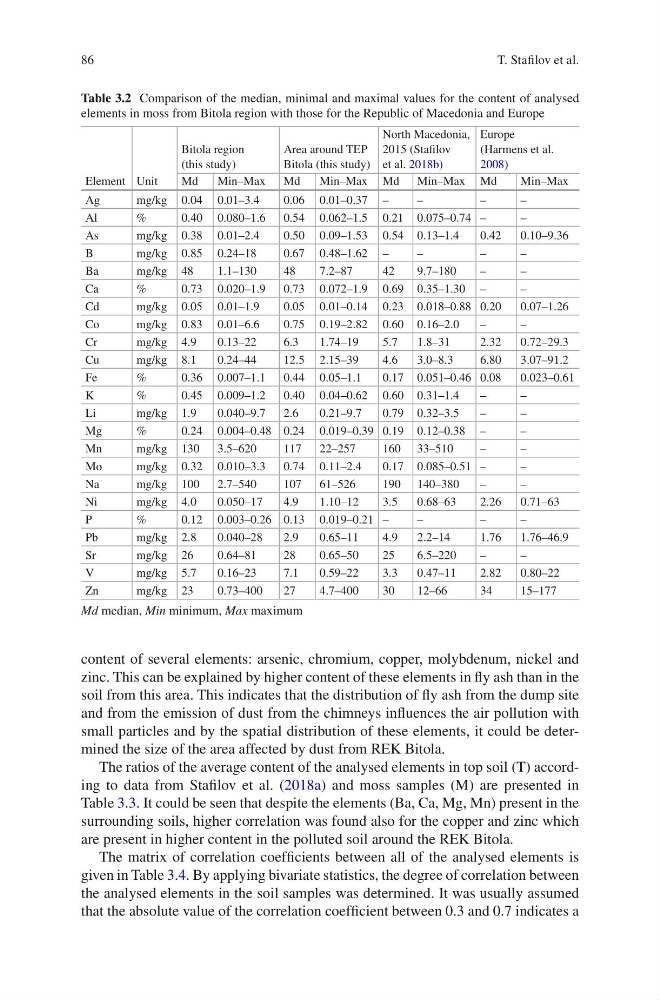
content of several elements: arsenic, chromium, copper, molybdenum, nickel and
zinc. This can be explained by higher content of these elements in fly ash than in the
soil from this area. This indicates that the distribution of fly ash from the dump site
and from the emission of dust from the chimneys influences the air pollution with
small particles and by the spatial distribution of these elements, it could be determined the size of the area affected by dust from REK Bitola.
The ratios of the average content of the analysed elements in top soil (T) according to data from Stafilov et al. (2018a) and moss samples (M) are presented in
Table 3.3. It could be seen that despite the elements (Ba, Ca, Mg, Mn) present in the
surrounding soils, higher correlation was found also for the copper and zinc which
are present in higher content in the polluted soil around the REK Bitola.
The matrix of correlation coefficients between all of the analysed elements is
given in Table 3.4. By applying bivariate statistics, the degree of correlation between
the analysed elements in the soil samples was determined. It was usually assumed
that the absolute value of the correlation coefficient between 0.3 and 0.7 indicates a
Table 3.2 Comparison of the median, minimal and maximal values for the content of analysed
elements in moss from Bitola region with those for the Republic of Macedonia and Europe
Element Unit
Bitola region
(this study)
Area around TEP
Bitola (this study)
North Macedonia,
2015 (Stafilov
et al. 2018b)
Europe
(Harmens et al.
2008)
Md
Min–Max
Md
Min–Max Md Min–Max Md
Min–Max
Ag
mg/kg 0.04 0.01–3.4
0.06 0.01–0.37 –
–
–
–
Al
%
0.40 0.080–1.6 0.54 0.062–1.5 0.21 0.075–0.74 –
–
As
mg/kg 0.38 0.01–2.4
0.50 0.09–1.53 0.54 0.13–1.4
0.42
0.10–9.36
B
mg/kg 0.85 0.24–18
0.67 0.48–1.62 –
–
–
–
Ba
mg/kg 48
1.1–130
48
7.2–87
42
9.7–180
–
–
Ca
%
0.73 0.020–1.9 0.73 0.072–1.9 0.69 0.35–1.30 –
–
Cd
mg/kg 0.05 0.01–1.9
0.05 0.01–0.14 0.23 0.018–0.88 0.20
0.07–1.26
Co
mg/kg 0.83 0.01–6.6
0.75 0.19–2.82 0.60 0.16–2.0
–
–
Cr
mg/kg 4.9
0.13–22
6.3
1.74–19
5.7
1.8–31
2.32
0.72–29.3
Cu
mg/kg 8.1
0.24–44
12.5 2.15–39
4.6
3.0–8.3
6.80
3.07–91.2
Fe
%
0.36 0.007–1.1 0.44 0.05–1.1
0.17 0.051–0.46 0.08
0.023–0.61
K
%
0.45 0.009–1.2 0.40 0.04–0.62 0.60 0.31–1.4
–
–
Li
mg/kg 1.9
0.040–9.7 2.6
0.21–9.7
0.79 0.32–3.5
–
–
Mg
%
0.24 0.004–0.48 0.24 0.019–0.39 0.19 0.12–0.38 –
–
Mn
mg/kg 130 3.5–620
117 22–257
160 33–510
–
–
Mo
mg/kg 0.32 0.010–3.3 0.74 0.11–2.4
0.17 0.085–0.51 –
–
Na
mg/kg 100 2.7–540
107 61–526
190 140–380
–
–
Ni
mg/kg 4.0
0.050–17
4.9
1.10–12
3.5
0.68–63
2.26
0.71–63
P
%
0.12 0.003–0.26 0.13 0.019–0.21 –
–
–
–
Pb
mg/kg 2.8
0.040–28
2.9
0.65–11
4.9
2.2–14
1.76
1.76–46.9
Sr
mg/kg 26
0.64–81
28
0.65–50
25
6.5–220
–
–
V
mg/kg 5.7
0.16–23
7.1
0.59–22
3.3
0.47–11
2.82
0.80–22
Zn
mg/kg 23
0.73–400
27
4.7–400
30
12–66
34
15–177
Md median, Min minimum, Max maximum
T. Stafilov et al.
content of several elements: arsenic, chromium, copper, molybdenum, nickel and
zinc. This can be explained by higher content of these elements in fly ash than in the
soil from this area. This indicates that the distribution of fly ash from the dump site
and from the emission of dust from the chimneys influences the air pollution with
small particles and by the spatial distribution of these elements, it could be determined the size of the area affected by dust from REK Bitola.
The ratios of the average content of the analysed elements in top soil (T) according to data from Stafilov et al. (2018a) and moss samples (M) are presented in
Table 3.3. It could be seen that despite the elements (Ba, Ca, Mg, Mn) present in the
surrounding soils, higher correlation was found also for the copper and zinc which
are present in higher content in the polluted soil around the REK Bitola.
The matrix of correlation coefficients between all of the analysed elements is
given in Table 3.4. By applying bivariate statistics, the degree of correlation between
the analysed elements in the soil samples was determined. It was usually assumed
that the absolute value of the correlation coefficient between 0.3 and 0.7 indicates a
Table 3.2 Comparison of the median, minimal and maximal values for the content of analysed
elements in moss from Bitola region with those for the Republic of Macedonia and Europe
Element Unit
Bitola region
(this study)
Area around TEP
Bitola (this study)
North Macedonia,
2015 (Stafilov
et al. 2018b)
Europe
(Harmens et al.
2008)
Md
Min–Max
Md
Min–Max Md Min–Max Md
Min–Max
Ag
mg/kg 0.04 0.01–3.4
0.06 0.01–0.37 –
–
–
–
Al
%
0.40 0.080–1.6 0.54 0.062–1.5 0.21 0.075–0.74 –
–
As
mg/kg 0.38 0.01–2.4
0.50 0.09–1.53 0.54 0.13–1.4
0.42
0.10–9.36
B
mg/kg 0.85 0.24–18
0.67 0.48–1.62 –
–
–
–
Ba
mg/kg 48
1.1–130
48
7.2–87
42
9.7–180
–
–
Ca
%
0.73 0.020–1.9 0.73 0.072–1.9 0.69 0.35–1.30 –
–
Cd
mg/kg 0.05 0.01–1.9
0.05 0.01–0.14 0.23 0.018–0.88 0.20
0.07–1.26
Co
mg/kg 0.83 0.01–6.6
0.75 0.19–2.82 0.60 0.16–2.0
–
–
Cr
mg/kg 4.9
0.13–22
6.3
1.74–19
5.7
1.8–31
2.32
0.72–29.3
Cu
mg/kg 8.1
0.24–44
12.5 2.15–39
4.6
3.0–8.3
6.80
3.07–91.2
Fe
%
0.36 0.007–1.1 0.44 0.05–1.1
0.17 0.051–0.46 0.08
0.023–0.61
K
%
0.45 0.009–1.2 0.40 0.04–0.62 0.60 0.31–1.4
–
–
Li
mg/kg 1.9
0.040–9.7 2.6
0.21–9.7
0.79 0.32–3.5
–
–
Mg
%
0.24 0.004–0.48 0.24 0.019–0.39 0.19 0.12–0.38 –
–
Mn
mg/kg 130 3.5–620
117 22–257
160 33–510
–
–
Mo
mg/kg 0.32 0.010–3.3 0.74 0.11–2.4
0.17 0.085–0.51 –
–
Na
mg/kg 100 2.7–540
107 61–526
190 140–380
–
–
Ni
mg/kg 4.0
0.050–17
4.9
1.10–12
3.5
0.68–63
2.26
0.71–63
P
%
0.12 0.003–0.26 0.13 0.019–0.21 –
–
–
–
Pb
mg/kg 2.8
0.040–28
2.9
0.65–11
4.9
2.2–14
1.76
1.76–46.9
Sr
mg/kg 26
0.64–81
28
0.65–50
25
6.5–220
–
–
V
mg/kg 5.7
0.16–23
7.1
0.59–22
3.3
0.47–11
2.82
0.80–22
Zn
mg/kg 23
0.73–400
27
4.7–400
30
12–66
34
15–177
Md median, Min minimum, Max maximum
T. Stafilov et al.