

Carbon Footprint of Karnataka: Accounting of Sources and Sinks
75
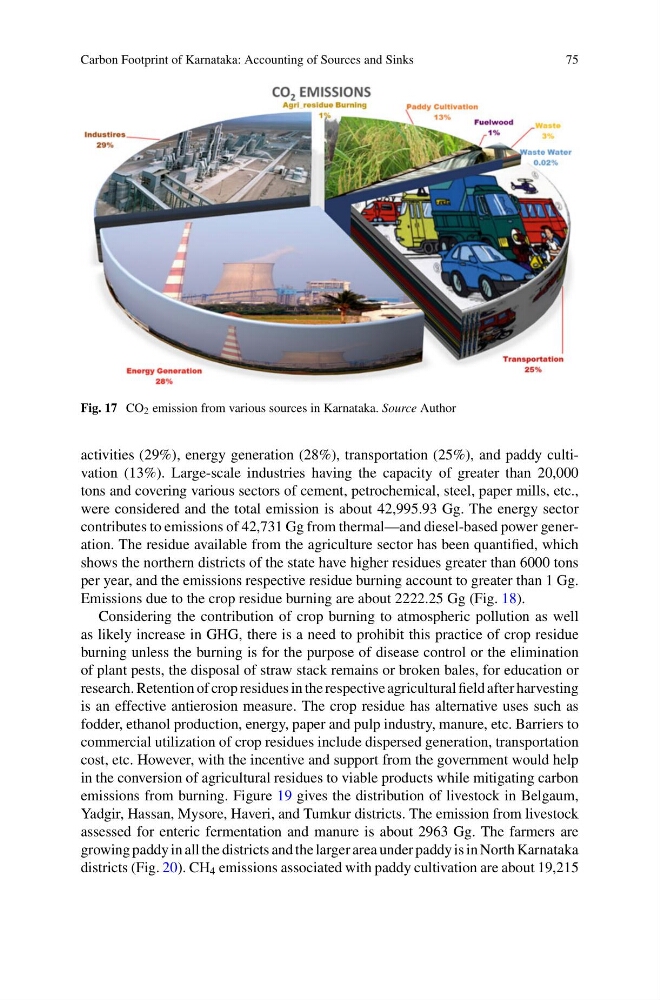
Fig. 17 CO 2 emission from various sources in Karnataka. Source Author
activities (29%), energy generation (28%), transportation (25%), and paddy cultivation (13%). Large-scale industries having the capacity of greater than 20,000
tons and covering various sectors of cement, petrochemical, steel, paper mills, etc.,
were considered and the total emission is about 42,995.93 Gg. The energy sector
contributes to emissions of 42,731 Gg from thermal—and diesel-based power generation. The residue available from the agriculture sector has been quantified, which
shows the northern districts of the state have higher residues greater than 6000 tons
per year, and the emissions respective residue burning account to greater than 1 Gg.
Emissions due to the crop residue burning are about 2222.25 Gg (Fig. 18).
Considering the contribution of crop burning to atmospheric pollution as well
as likely increase in GHG, there is a need to prohibit this practice of crop residue
burning unless the burning is for the purpose of disease control or the elimination
of plant pests, the disposal of straw stack remains or broken bales, for education or
research. Retention of crop residues in the respective agricultural field after harvesting
is an effective antierosion measure. The crop residue has alternative uses such as
fodder, ethanol production, energy, paper and pulp industry, manure, etc. Barriers to
commercial utilization of crop residues include dispersed generation, transportation
cost, etc. However, with the incentive and support from the government would help
in the conversion of agricultural residues to viable products while mitigating carbon
emissions from burning. Figure 19 gives the distribution of livestock in Belgaum,
Yadgir, Hassan, Mysore, Haveri, and Tumkur districts. The emission from livestock
assessed for enteric fermentation and manure is about 2963 Gg. The farmers are
growing paddy in all the districts and the larger area under paddy is in North Karnataka
districts (Fig. 20). CH 4 emissions associated with paddy cultivation are about 19,215
75
Fig. 17 CO 2 emission from various sources in Karnataka. Source Author
activities (29%), energy generation (28%), transportation (25%), and paddy cultivation (13%). Large-scale industries having the capacity of greater than 20,000
tons and covering various sectors of cement, petrochemical, steel, paper mills, etc.,
were considered and the total emission is about 42,995.93 Gg. The energy sector
contributes to emissions of 42,731 Gg from thermal—and diesel-based power generation. The residue available from the agriculture sector has been quantified, which
shows the northern districts of the state have higher residues greater than 6000 tons
per year, and the emissions respective residue burning account to greater than 1 Gg.
Emissions due to the crop residue burning are about 2222.25 Gg (Fig. 18).
Considering the contribution of crop burning to atmospheric pollution as well
as likely increase in GHG, there is a need to prohibit this practice of crop residue
burning unless the burning is for the purpose of disease control or the elimination
of plant pests, the disposal of straw stack remains or broken bales, for education or
research. Retention of crop residues in the respective agricultural field after harvesting
is an effective antierosion measure. The crop residue has alternative uses such as
fodder, ethanol production, energy, paper and pulp industry, manure, etc. Barriers to
commercial utilization of crop residues include dispersed generation, transportation
cost, etc. However, with the incentive and support from the government would help
in the conversion of agricultural residues to viable products while mitigating carbon
emissions from burning. Figure 19 gives the distribution of livestock in Belgaum,
Yadgir, Hassan, Mysore, Haveri, and Tumkur districts. The emission from livestock
assessed for enteric fermentation and manure is about 2963 Gg. The farmers are
growing paddy in all the districts and the larger area under paddy is in North Karnataka
districts (Fig. 20). CH 4 emissions associated with paddy cultivation are about 19,215