

Carbon Footprint of Karnataka: Accounting of Sources and Sinks
71
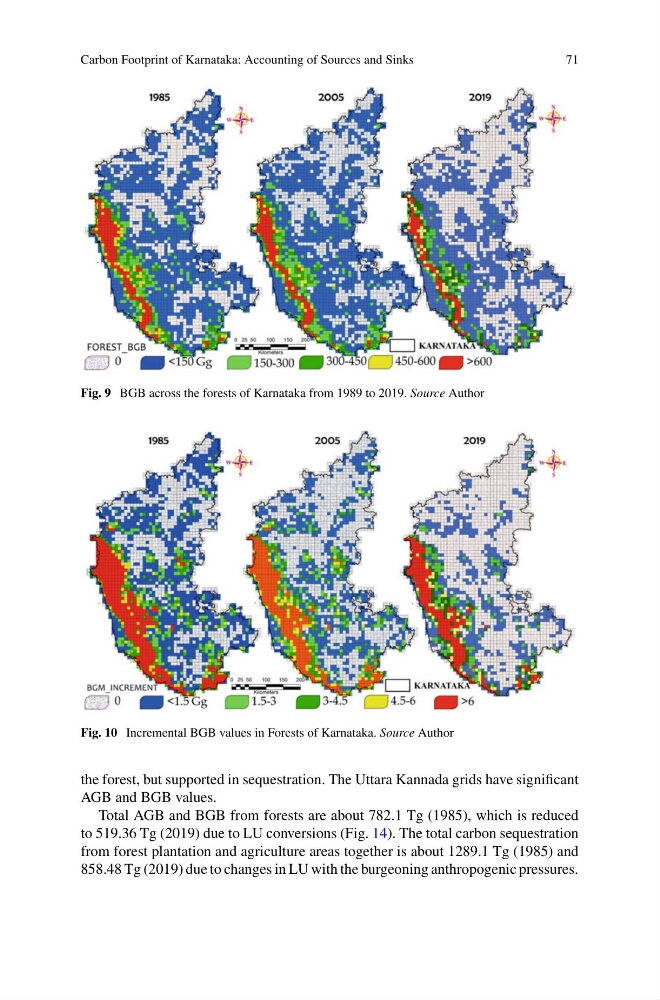
Fig. 9 BGB across the forests of Karnataka from 1989 to 2019. Source Author
Fig. 10 Incremental BGB values in Forests of Karnataka. Source Author
the forest, but supported in sequestration. The Uttara Kannada grids have significant
AGB and BGB values.
Total AGB and BGB from forests are about 782.1 Tg (1985), which is reduced
to 519.36 Tg (2019) due to LU conversions (Fig. 14). The total carbon sequestration
from forest plantation and agriculture areas together is about 1289.1 Tg (1985) and
858.48 Tg (2019) due to changes in LU with the burgeoning anthropogenic pressures.
71
Fig. 9 BGB across the forests of Karnataka from 1989 to 2019. Source Author
Fig. 10 Incremental BGB values in Forests of Karnataka. Source Author
the forest, but supported in sequestration. The Uttara Kannada grids have significant
AGB and BGB values.
Total AGB and BGB from forests are about 782.1 Tg (1985), which is reduced
to 519.36 Tg (2019) due to LU conversions (Fig. 14). The total carbon sequestration
from forest plantation and agriculture areas together is about 1289.1 Tg (1985) and
858.48 Tg (2019) due to changes in LU with the burgeoning anthropogenic pressures.