

68
T. V. Ramachandra and S. Bharath
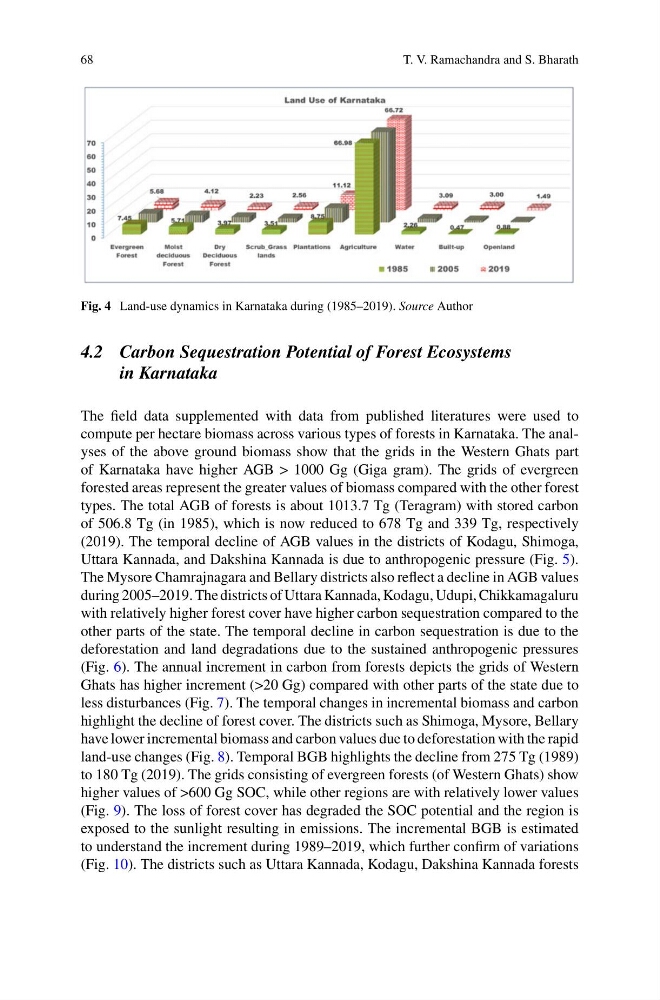
Fig. 4 Land-use dynamics in Karnataka during (1985–2019). Source Author
4.2 Carbon Sequestration Potential of Forest Ecosystems
in Karnataka
The field data supplemented with data from published literatures were used to
compute per hectare biomass across various types of forests in Karnataka. The analyses of the above ground biomass show that the grids in the Western Ghats part
of Karnataka have higher AGB > 1000 Gg (Giga gram). The grids of evergreen
forested areas represent the greater values of biomass compared with the other forest
types. The total AGB of forests is about 1013.7 Tg (Teragram) with stored carbon
of 506.8 Tg (in 1985), which is now reduced to 678 Tg and 339 Tg, respectively
(2019). The temporal decline of AGB values in the districts of Kodagu, Shimoga,
Uttara Kannada, and Dakshina Kannada is due to anthropogenic pressure (Fig. 5).
The Mysore Chamrajnagara and Bellary districts also reflect a decline in AGB values
during 2005–2019. The districts of Uttara Kannada, Kodagu, Udupi, Chikkamagaluru
with relatively higher forest cover have higher carbon sequestration compared to the
other parts of the state. The temporal decline in carbon sequestration is due to the
deforestation and land degradations due to the sustained anthropogenic pressures
(Fig. 6). The annual increment in carbon from forests depicts the grids of Western
Ghats has higher increment (>20 Gg) compared with other parts of the state due to
less disturbances (Fig. 7). The temporal changes in incremental biomass and carbon
highlight the decline of forest cover. The districts such as Shimoga, Mysore, Bellary
have lower incremental biomass and carbon values due to deforestation with the rapid
land-use changes (Fig. 8). Temporal BGB highlights the decline from 275 Tg (1989)
to 180 Tg (2019). The grids consisting of evergreen forests (of Western Ghats) show
higher values of >600 Gg SOC, while other regions are with relatively lower values
(Fig. 9). The loss of forest cover has degraded the SOC potential and the region is
exposed to the sunlight resulting in emissions. The incremental BGB is estimated
to understand the increment during 1989–2019, which further confirm of variations
(Fig. 10). The districts such as Uttara Kannada, Kodagu, Dakshina Kannada forests
T. V. Ramachandra and S. Bharath
Fig. 4 Land-use dynamics in Karnataka during (1985–2019). Source Author
4.2 Carbon Sequestration Potential of Forest Ecosystems
in Karnataka
The field data supplemented with data from published literatures were used to
compute per hectare biomass across various types of forests in Karnataka. The analyses of the above ground biomass show that the grids in the Western Ghats part
of Karnataka have higher AGB > 1000 Gg (Giga gram). The grids of evergreen
forested areas represent the greater values of biomass compared with the other forest
types. The total AGB of forests is about 1013.7 Tg (Teragram) with stored carbon
of 506.8 Tg (in 1985), which is now reduced to 678 Tg and 339 Tg, respectively
(2019). The temporal decline of AGB values in the districts of Kodagu, Shimoga,
Uttara Kannada, and Dakshina Kannada is due to anthropogenic pressure (Fig. 5).
The Mysore Chamrajnagara and Bellary districts also reflect a decline in AGB values
during 2005–2019. The districts of Uttara Kannada, Kodagu, Udupi, Chikkamagaluru
with relatively higher forest cover have higher carbon sequestration compared to the
other parts of the state. The temporal decline in carbon sequestration is due to the
deforestation and land degradations due to the sustained anthropogenic pressures
(Fig. 6). The annual increment in carbon from forests depicts the grids of Western
Ghats has higher increment (>20 Gg) compared with other parts of the state due to
less disturbances (Fig. 7). The temporal changes in incremental biomass and carbon
highlight the decline of forest cover. The districts such as Shimoga, Mysore, Bellary
have lower incremental biomass and carbon values due to deforestation with the rapid
land-use changes (Fig. 8). Temporal BGB highlights the decline from 275 Tg (1989)
to 180 Tg (2019). The grids consisting of evergreen forests (of Western Ghats) show
higher values of >600 Gg SOC, while other regions are with relatively lower values
(Fig. 9). The loss of forest cover has degraded the SOC potential and the region is
exposed to the sunlight resulting in emissions. The incremental BGB is estimated
to understand the increment during 1989–2019, which further confirm of variations
(Fig. 10). The districts such as Uttara Kannada, Kodagu, Dakshina Kannada forests