

Carbon Footprint of Food Waste Management: A Case …
41
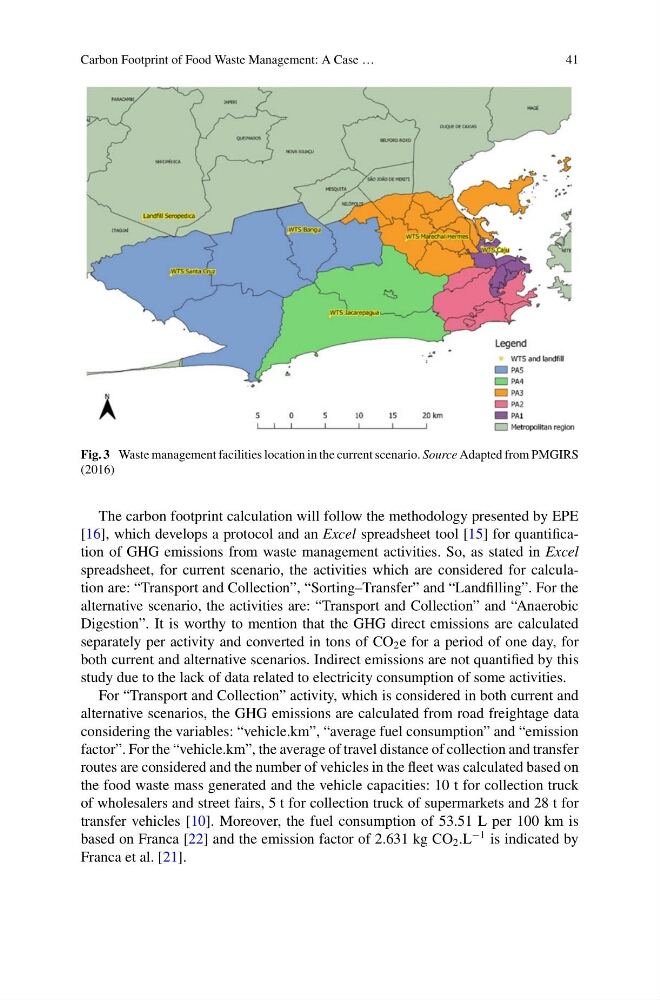
Fig. 3 Waste management facilities location in the current scenario. Source Adapted from PMGIRS
(2016)
The carbon footprint calculation will follow the methodology presented by EPE
[16], which develops a protocol and an Excel spreadsheet tool [15] for quantification of GHG emissions from waste management activities. So, as stated in Excel
spreadsheet, for current scenario, the activities which are considered for calculation are: “Transport and Collection”, “Sorting–Transfer” and “Landfilling”. For the
alternative scenario, the activities are: “Transport and Collection” and “Anaerobic
Digestion”. It is worthy to mention that the GHG direct emissions are calculated
separately per activity and converted in tons of CO 2 e for a period of one day, for
both current and alternative scenarios. Indirect emissions are not quantified by this
study due to the lack of data related to electricity consumption of some activities.
For “Transport and Collection” activity, which is considered in both current and
alternative scenarios, the GHG emissions are calculated from road freightage data
considering the variables: “vehicle.km”, “average fuel consumption” and “emission
factor”. For the “vehicle.km”, the average of travel distance of collection and transfer
routes are considered and the number of vehicles in the fleet was calculated based on
the food waste mass generated and the vehicle capacities: 10 t for collection truck
of wholesalers and street fairs, 5 t for collection truck of supermarkets and 28 t for
transfer vehicles [10]. Moreover, the fuel consumption of 53.51 L per 100 km is
based on Franca [22] and the emission factor of 2.631 kg CO 2 .L
−1 is indicated by
Franca et al. [21].
41
Fig. 3 Waste management facilities location in the current scenario. Source Adapted from PMGIRS
(2016)
The carbon footprint calculation will follow the methodology presented by EPE
[16], which develops a protocol and an Excel spreadsheet tool [15] for quantification of GHG emissions from waste management activities. So, as stated in Excel
spreadsheet, for current scenario, the activities which are considered for calculation are: “Transport and Collection”, “Sorting–Transfer” and “Landfilling”. For the
alternative scenario, the activities are: “Transport and Collection” and “Anaerobic
Digestion”. It is worthy to mention that the GHG direct emissions are calculated
separately per activity and converted in tons of CO 2 e for a period of one day, for
both current and alternative scenarios. Indirect emissions are not quantified by this
study due to the lack of data related to electricity consumption of some activities.
For “Transport and Collection” activity, which is considered in both current and
alternative scenarios, the GHG emissions are calculated from road freightage data
considering the variables: “vehicle.km”, “average fuel consumption” and “emission
factor”. For the “vehicle.km”, the average of travel distance of collection and transfer
routes are considered and the number of vehicles in the fleet was calculated based on
the food waste mass generated and the vehicle capacities: 10 t for collection truck
of wholesalers and street fairs, 5 t for collection truck of supermarkets and 28 t for
transfer vehicles [10]. Moreover, the fuel consumption of 53.51 L per 100 km is
based on Franca [22] and the emission factor of 2.631 kg CO 2 .L
−1 is indicated by
Franca et al. [21].