

106
A. S. Santos et al.
Table 2 (continued)
Examples of
measures
Case study
Costs
analysis
Estimated costs ($) References
Metro
Hanoi Metro Line
2A Stats
(Very)
High
Construction Cost
Per km: US$66.259
million
Clark [16],Hanoi
metro [29]
Shanghai Metro
Line 1 Stats
Construction Cost
Per km: US$18.634
million/US$33.168
million (2019)
Clark [16]
Europe projects
Costs per
route-kilometer
(including stations
and rolling stock):
US$50–100 million
(2002 prices)
Flyvbjerg et al.
[24]
US projects
US projects - the
range is US$50–150
million
Flyvbjerg et al.
[24]
In addition to BRT, there are other mass transit systems such as Light-rail transit
(LRT) and Metro. We emphasize that, although these systems correspond to metrorail transport, they directly impact cities and road traffic. As an example of cost
associated with LRT, there are the five LRT projects in the United States considered
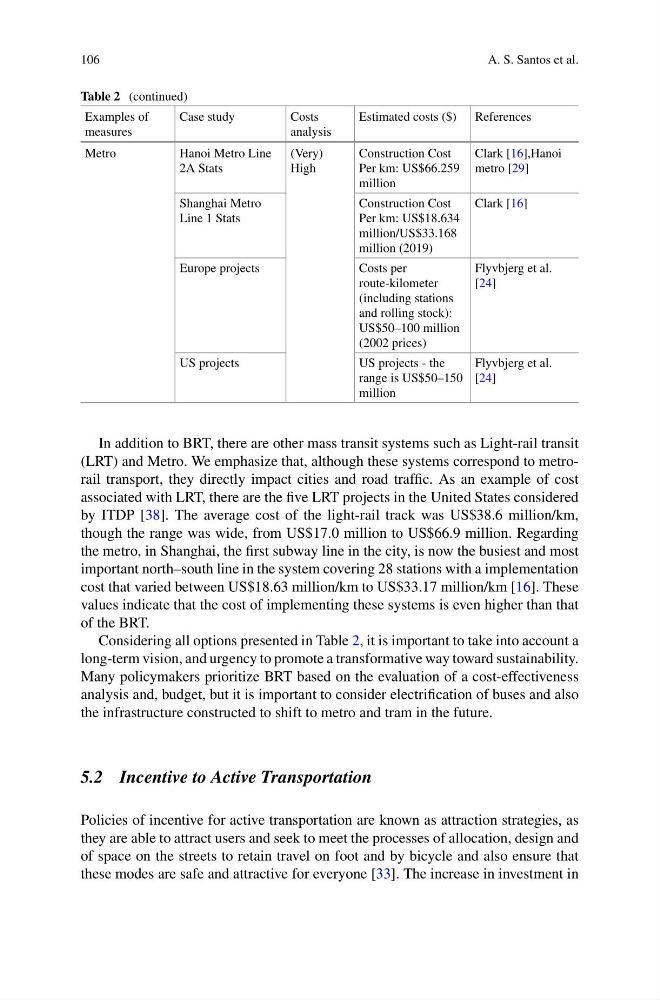
by ITDP [38]. The average cost of the light-rail track was US$38.6 million/km,
though the range was wide, from US$17.0 million to US$66.9 million. Regarding
the metro, in Shanghai, the first subway line in the city, is now the busiest and most
important north–south line in the system covering 28 stations with a implementation
cost that varied between US$18.63 million/km to US$33.17 million/km [16]. These
values indicate that the cost of implementing these systems is even higher than that
of the BRT.
Considering all options presented in Table 2, it is important to take into account a
long-term vision, and urgency to promote a transformative way toward sustainability.
Many policymakers prioritize BRT based on the evaluation of a cost-effectiveness
analysis and, budget, but it is important to consider electrification of buses and also
the infrastructure constructed to shift to metro and tram in the future.
5.2 Incentive to Active Transportation
Policies of incentive for active transportation are known as attraction strategies, as
they are able to attract users and seek to meet the processes of allocation, design and
of space on the streets to retain travel on foot and by bicycle and also ensure that
these modes are safe and attractive for everyone [33]. The increase in investment in
A. S. Santos et al.
Table 2 (continued)
Examples of
measures
Case study
Costs
analysis
Estimated costs ($) References
Metro
Hanoi Metro Line
2A Stats
(Very)
High
Construction Cost
Per km: US$66.259
million
Clark [16],Hanoi
metro [29]
Shanghai Metro
Line 1 Stats
Construction Cost
Per km: US$18.634
million/US$33.168
million (2019)
Clark [16]
Europe projects
Costs per
route-kilometer
(including stations
and rolling stock):
US$50–100 million
(2002 prices)
Flyvbjerg et al.
[24]
US projects
US projects - the
range is US$50–150
million
Flyvbjerg et al.
[24]
In addition to BRT, there are other mass transit systems such as Light-rail transit
(LRT) and Metro. We emphasize that, although these systems correspond to metrorail transport, they directly impact cities and road traffic. As an example of cost
associated with LRT, there are the five LRT projects in the United States considered
by ITDP [38]. The average cost of the light-rail track was US$38.6 million/km,
though the range was wide, from US$17.0 million to US$66.9 million. Regarding
the metro, in Shanghai, the first subway line in the city, is now the busiest and most
important north–south line in the system covering 28 stations with a implementation
cost that varied between US$18.63 million/km to US$33.17 million/km [16]. These
values indicate that the cost of implementing these systems is even higher than that
of the BRT.
Considering all options presented in Table 2, it is important to take into account a
long-term vision, and urgency to promote a transformative way toward sustainability.
Many policymakers prioritize BRT based on the evaluation of a cost-effectiveness
analysis and, budget, but it is important to consider electrification of buses and also
the infrastructure constructed to shift to metro and tram in the future.
5.2 Incentive to Active Transportation
Policies of incentive for active transportation are known as attraction strategies, as
they are able to attract users and seek to meet the processes of allocation, design and
of space on the streets to retain travel on foot and by bicycle and also ensure that
these modes are safe and attractive for everyone [33]. The increase in investment in