

Ascertainment of Ecological Footprint …
89
outputs are presented immediately after Table 5. The short- and long-run relationships between the dependent (ecological footprint) and the independent (energy use,
agriculture and population) variables as displayed on the table are interpreted and
explained as follows: environmental Kuznets curve is confirmed for China with positive and negative relationships that existed among GDP per capita, squared GDP per
capita, and ecological footprint. At first, a positive relationship is established between
GDP per capita and ecological footprint at 5% significant level depicting increase
in economic growth is overshooting ecological footprint, but a negative relationship
existed between squared GDP per capita and ecological footprint at 5% significant
level. This scenario supports the Kuznets hypothesis of straining the ecology at the
expense of economic growth. Numerically, a percentage increase in GDP per capita
will lead to 0.000348 increase of ecological footprint, while for squared GDP per
capita, a percent increase in economic growth will lead to 0.00000109 degrease in
ecological footprint. This supports the findings by Kivyiro and Arminen [14]. Positive relationship is established between energy use and ecological footprint both
in short and long run. This implies a percent increase in energy use will lead to
0.001188% increase in ecology (poor environment). This finding is in consonance
with the finding of Udemba et al. [35] for Indonesia. Also, for the case of agriculture and population, positive relationship is established both in short and long
run for the both variables. A percent increase in agriculture and population will,
respectively, lead to 0.0000000000498 (4.98E−12) and 0.0000000255 (2.55E−09)
increase in ecological footprint (poor environment). These findings support the findings by udemba [36] for India; Liu et al. [18] and Ullah et al. [37]; Wang et al. [40].
In summary, the output of the cointegration with regard to short run and long run
shows that the selected variables are really impacting ecology unfavorably.
4.4 Diagnostic Tests (CUSUM and CUSUM 2 )
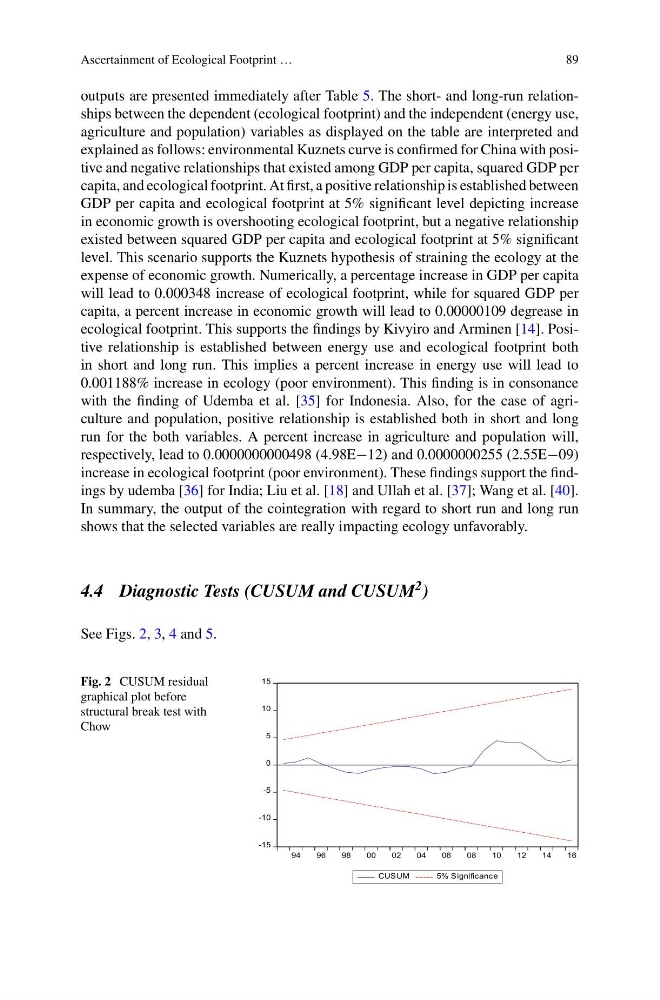
See Figs. 2, 3, 4 and 5.
Fig. 2 CUSUM residual
graphical plot before
structural break test with
Chow
-15
-10
-5
0
5
10
15
94
96
98
00
02
04
06
08
10
12
14
16
CUSUM
5% Significance
89
outputs are presented immediately after Table 5. The short- and long-run relationships between the dependent (ecological footprint) and the independent (energy use,
agriculture and population) variables as displayed on the table are interpreted and
explained as follows: environmental Kuznets curve is confirmed for China with positive and negative relationships that existed among GDP per capita, squared GDP per
capita, and ecological footprint. At first, a positive relationship is established between
GDP per capita and ecological footprint at 5% significant level depicting increase
in economic growth is overshooting ecological footprint, but a negative relationship
existed between squared GDP per capita and ecological footprint at 5% significant
level. This scenario supports the Kuznets hypothesis of straining the ecology at the
expense of economic growth. Numerically, a percentage increase in GDP per capita
will lead to 0.000348 increase of ecological footprint, while for squared GDP per
capita, a percent increase in economic growth will lead to 0.00000109 degrease in
ecological footprint. This supports the findings by Kivyiro and Arminen [14]. Positive relationship is established between energy use and ecological footprint both
in short and long run. This implies a percent increase in energy use will lead to
0.001188% increase in ecology (poor environment). This finding is in consonance
with the finding of Udemba et al. [35] for Indonesia. Also, for the case of agriculture and population, positive relationship is established both in short and long
run for the both variables. A percent increase in agriculture and population will,
respectively, lead to 0.0000000000498 (4.98E−12) and 0.0000000255 (2.55E−09)
increase in ecological footprint (poor environment). These findings support the findings by udemba [36] for India; Liu et al. [18] and Ullah et al. [37]; Wang et al. [40].
In summary, the output of the cointegration with regard to short run and long run
shows that the selected variables are really impacting ecology unfavorably.
4.4 Diagnostic Tests (CUSUM and CUSUM 2 )
See Figs. 2, 3, 4 and 5.
Fig. 2 CUSUM residual
graphical plot before
structural break test with
Chow
-15
-10
-5
0
5
10
15
94
96
98
00
02
04
06
08
10
12
14
16
CUSUM
5% Significance