

Ascertainment of Ecological Footprint …
87
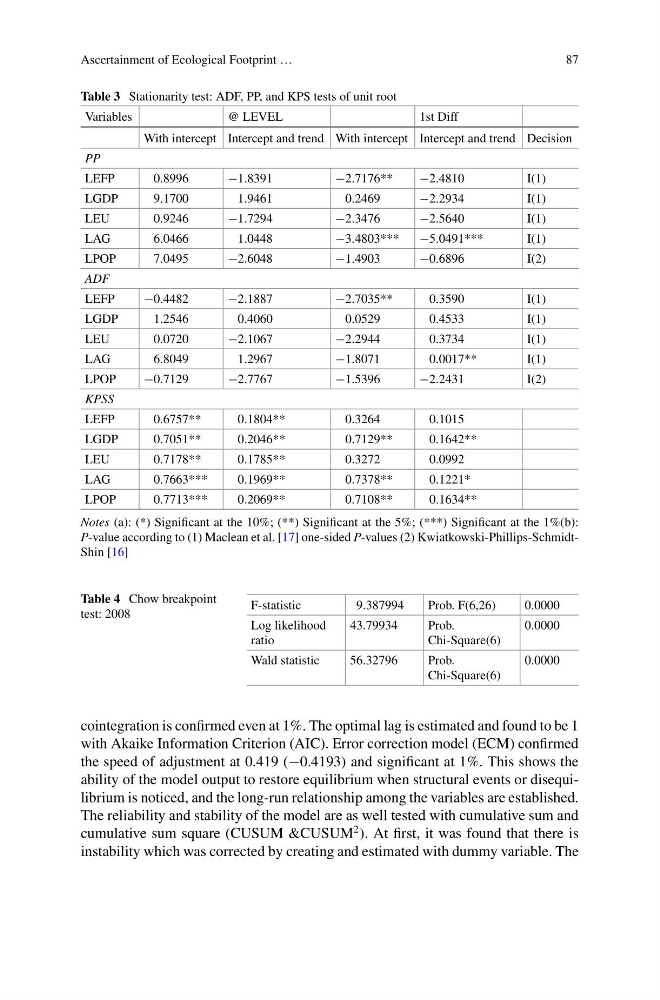
Table 3 Stationarity test: ADF, PP, and KPS tests of unit root
Variables
@ LEVEL
1st Diff
With intercept Intercept and trend With intercept Intercept and trend Decision
PP
LEFP
0.8996
−1.8391
−2.7176**
−2.4810
I(1)
LGDP
9.1700
1.9461
0.2469
−2.2934
I(1)
LEU
0.9246
−1.7294
−2.3476
−2.5640
I(1)
LAG
6.0466
1.0448
−3.4803***
−5.0491***
I(1)
LPOP
7.0495
−2.6048
−1.4903
−0.6896
I(2)
ADF
LEFP
−0.4482
−2.1887
−2.7035**
0.3590
I(1)
LGDP
1.2546
0.4060
0.0529
0.4533
I(1)
LEU
0.0720
−2.1067
−2.2944
0.3734
I(1)
LAG
6.8049
1.2967
−1.8071
0.0017**
I(1)
LPOP
−0.7129
−2.7767
−1.5396
−2.2431
I(2)
KPSS
LEFP
0.6757**
0.1804**
0.3264
0.1015
LGDP
0.7051**
0.2046**
0.7129**
0.1642**
LEU
0.7178**
0.1785**
0.3272
0.0992
LAG
0.7663***
0.1969**
0.7378**
0.1221*
LPOP
0.7713***
0.2069**
0.7108**
0.1634**
Notes (a): (*) Significant at the 10%; (**) Significant at the 5%; (***) Significant at the 1%(b):
P-value according to (1) Maclean et al. [17] one-sided P-values (2) Kwiatkowski-Phillips-SchmidtShin [16]
Table 4 Chow breakpoint
test: 2008
F-statistic
9.387994
Prob. F(6,26)
0.0000
Log likelihood
ratio
43.79934
Prob.
Chi-Square(6)
0.0000
Wald statistic
56.32796
Prob.
Chi-Square(6)
0.0000
cointegration is confirmed even at 1%. The optimal lag is estimated and found to be 1
with Akaike Information Criterion (AIC). Error correction model (ECM) confirmed
the speed of adjustment at 0.419 (−0.4193) and significant at 1%. This shows the
ability of the model output to restore equilibrium when structural events or disequilibrium is noticed, and the long-run relationship among the variables are established.
The reliability and stability of the model are as well tested with cumulative sum and
cumulative sum square (CUSUM &CUSUM
2 ). At first, it was found that there is
instability which was corrected by creating and estimated with dummy variable. The
87
Table 3 Stationarity test: ADF, PP, and KPS tests of unit root
Variables
@ LEVEL
1st Diff
With intercept Intercept and trend With intercept Intercept and trend Decision
PP
LEFP
0.8996
−1.8391
−2.7176**
−2.4810
I(1)
LGDP
9.1700
1.9461
0.2469
−2.2934
I(1)
LEU
0.9246
−1.7294
−2.3476
−2.5640
I(1)
LAG
6.0466
1.0448
−3.4803***
−5.0491***
I(1)
LPOP
7.0495
−2.6048
−1.4903
−0.6896
I(2)
ADF
LEFP
−0.4482
−2.1887
−2.7035**
0.3590
I(1)
LGDP
1.2546
0.4060
0.0529
0.4533
I(1)
LEU
0.0720
−2.1067
−2.2944
0.3734
I(1)
LAG
6.8049
1.2967
−1.8071
0.0017**
I(1)
LPOP
−0.7129
−2.7767
−1.5396
−2.2431
I(2)
KPSS
LEFP
0.6757**
0.1804**
0.3264
0.1015
LGDP
0.7051**
0.2046**
0.7129**
0.1642**
LEU
0.7178**
0.1785**
0.3272
0.0992
LAG
0.7663***
0.1969**
0.7378**
0.1221*
LPOP
0.7713***
0.2069**
0.7108**
0.1634**
Notes (a): (*) Significant at the 10%; (**) Significant at the 5%; (***) Significant at the 1%(b):
P-value according to (1) Maclean et al. [17] one-sided P-values (2) Kwiatkowski-Phillips-SchmidtShin [16]
Table 4 Chow breakpoint
test: 2008
F-statistic
9.387994
Prob. F(6,26)
0.0000
Log likelihood
ratio
43.79934
Prob.
Chi-Square(6)
0.0000
Wald statistic
56.32796
Prob.
Chi-Square(6)
0.0000
cointegration is confirmed even at 1%. The optimal lag is estimated and found to be 1
with Akaike Information Criterion (AIC). Error correction model (ECM) confirmed
the speed of adjustment at 0.419 (−0.4193) and significant at 1%. This shows the
ability of the model output to restore equilibrium when structural events or disequilibrium is noticed, and the long-run relationship among the variables are established.
The reliability and stability of the model are as well tested with cumulative sum and
cumulative sum square (CUSUM &CUSUM
2 ). At first, it was found that there is
instability which was corrected by creating and estimated with dummy variable. The