

24
C. Rivero-Camacho et al.
4.2 Definition of Use and Renewals Stages
For the purpose of this research, electricity consumption does not include variations
in habits or climate. However, if we take into account the variations caused by the
renovations planned in the building, which improve the energy efficiency. To this
end, different periods of consumption are established, the beginning and end of
which are marked by the different renovation works, the first from the construction
of the building to the year 20, the second from the year 21 to 40, the third from 41 to
70 and the last from 71 to 100. In each of these periods, the building’s consumption
is gradually reduced.
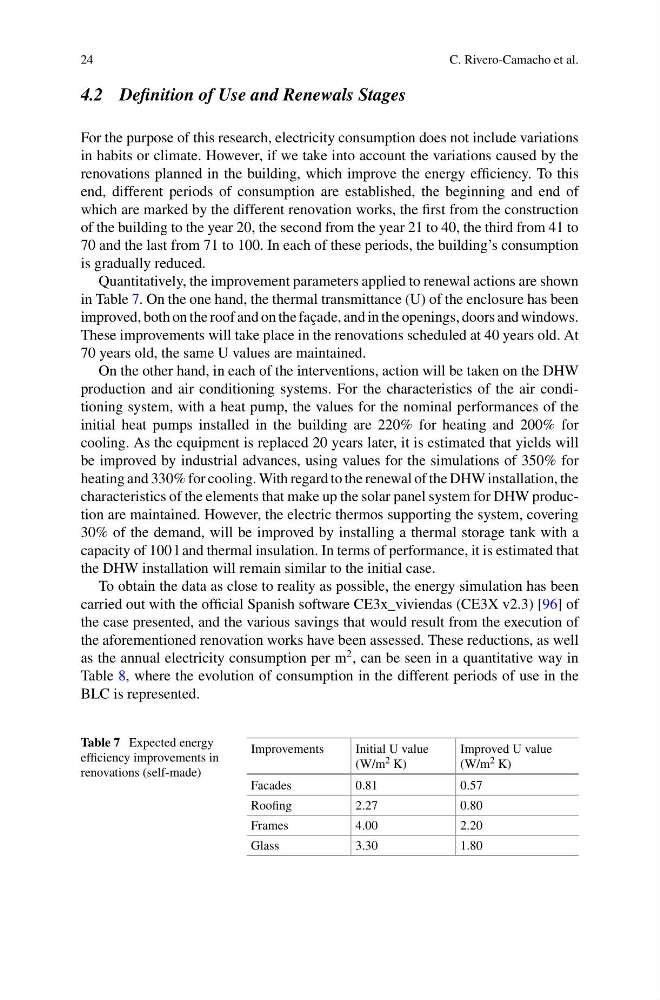
Quantitatively, the improvement parameters applied to renewal actions are shown
in Table 7. On the one hand, the thermal transmittance (U) of the enclosure has been
improved, both on the roof and on the façade, and in the openings, doors and windows.
These improvements will take place in the renovations scheduled at 40 years old. At
70 years old, the same U values are maintained.
On the other hand, in each of the interventions, action will be taken on the DHW
production and air conditioning systems. For the characteristics of the air conditioning system, with a heat pump, the values for the nominal performances of the
initial heat pumps installed in the building are 220% for heating and 200% for
cooling. As the equipment is replaced 20 years later, it is estimated that yields will
be improved by industrial advances, using values for the simulations of 350% for
heating and 330% for cooling. With regard to the renewal of the DHW installation, the
characteristics of the elements that make up the solar panel system for DHW production are maintained. However, the electric thermos supporting the system, covering
30% of the demand, will be improved by installing a thermal storage tank with a
capacity of 100 l and thermal insulation. In terms of performance, it is estimated that
the DHW installation will remain similar to the initial case.
To obtain the data as close to reality as possible, the energy simulation has been
carried out with the official Spanish software CE3x_viviendas (CE3X v2.3) [96] of
the case presented, and the various savings that would result from the execution of
the aforementioned renovation works have been assessed. These reductions, as well
as the annual electricity consumption per m
2 , can be seen in a quantitative way in
Table 8, where the evolution of consumption in the different periods of use in the
BLC is represented.
Table 7 Expected energy
efficiency improvements in
renovations (self-made)
Improvements
Initial U value
(W/m 2 K)
Improved U value
(W/m 2 K)
Facades
0.81
0.57
Roofing
2.27
0.80
Frames
4.00
2.20
Glass
3.30
1.80
C. Rivero-Camacho et al.
4.2 Definition of Use and Renewals Stages
For the purpose of this research, electricity consumption does not include variations
in habits or climate. However, if we take into account the variations caused by the
renovations planned in the building, which improve the energy efficiency. To this
end, different periods of consumption are established, the beginning and end of
which are marked by the different renovation works, the first from the construction
of the building to the year 20, the second from the year 21 to 40, the third from 41 to
70 and the last from 71 to 100. In each of these periods, the building’s consumption
is gradually reduced.
Quantitatively, the improvement parameters applied to renewal actions are shown
in Table 7. On the one hand, the thermal transmittance (U) of the enclosure has been
improved, both on the roof and on the façade, and in the openings, doors and windows.
These improvements will take place in the renovations scheduled at 40 years old. At
70 years old, the same U values are maintained.
On the other hand, in each of the interventions, action will be taken on the DHW
production and air conditioning systems. For the characteristics of the air conditioning system, with a heat pump, the values for the nominal performances of the
initial heat pumps installed in the building are 220% for heating and 200% for
cooling. As the equipment is replaced 20 years later, it is estimated that yields will
be improved by industrial advances, using values for the simulations of 350% for
heating and 330% for cooling. With regard to the renewal of the DHW installation, the
characteristics of the elements that make up the solar panel system for DHW production are maintained. However, the electric thermos supporting the system, covering
30% of the demand, will be improved by installing a thermal storage tank with a
capacity of 100 l and thermal insulation. In terms of performance, it is estimated that
the DHW installation will remain similar to the initial case.
To obtain the data as close to reality as possible, the energy simulation has been
carried out with the official Spanish software CE3x_viviendas (CE3X v2.3) [96] of
the case presented, and the various savings that would result from the execution of
the aforementioned renovation works have been assessed. These reductions, as well
as the annual electricity consumption per m
2 , can be seen in a quantitative way in
Table 8, where the evolution of consumption in the different periods of use in the
BLC is represented.
Table 7 Expected energy
efficiency improvements in
renovations (self-made)
Improvements
Initial U value
(W/m 2 K)
Improved U value
(W/m 2 K)
Facades
0.81
0.57
Roofing
2.27
0.80
Frames
4.00
2.20
Glass
3.30
1.80