

118
E. N. Udemba
4.4 Diagnostic Tests (Cumulative Sum and Cumulative Sum
Square, CUSUM and CUSM 2 )
-16
-12
-8
-4
0
4
8
12
16
90 92 94 96 98 00 02 04 06 08 10 12 14 16
CUSUM
5% Significance
-0.4
-0.2
0.0
0.2
0.4
0.6
0.8
1.0
1.2
1.4
90 92 94 96 98 00 02 04 06 08 10 12 14 16
CUSUM of Squares
5% Significance
5 Granger Causality Analysis (VECM)
Author applied causality analysis to test forecasting power of the selected variables
which will also act as robust check to the findings of short- and long-run cointegration
estimations. The linear and quadratic estimations of the ARDL might not give detail
insight on the relationships that exist among the variables. Positive and negative
interactions of the selected variables are possible without ascertaining the inducer
and the direction of the relationship among the variables if granger causality is
not considered. For a valid interpretation of the relationship that existed among
the variables with forecasting ability, the current study has undertaken the granger
causality analysis. Because of the mixed order of integration among the variables,
VAR granger causality/block exogeneity was applied, and the outcome is shown
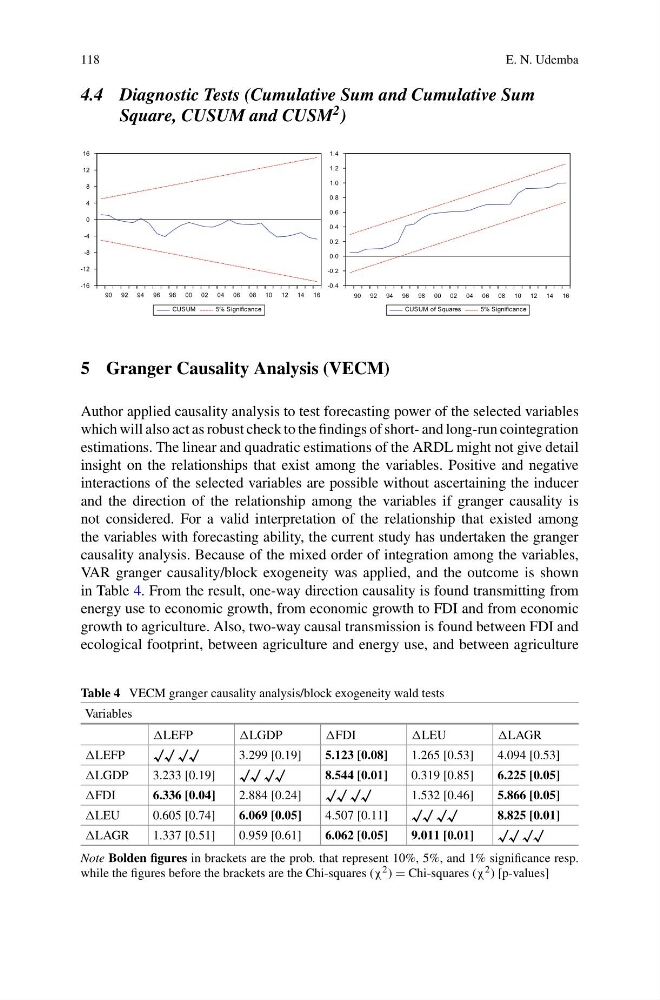
in Table 4. From the result, one-way direction causality is found transmitting from
energy use to economic growth, from economic growth to FDI and from economic
growth to agriculture. Also, two-way causal transmission is found between FDI and
ecological footprint, between agriculture and energy use, and between agriculture
Table 4 VECM granger causality analysis/block exogeneity wald tests
Variables
LGDP
FDI
LEU
LAGR
LEFP
√√ √√
3.299 [0.19]
5.123 [0.08]
1.265 [0.53]
4.094 [0.53]
LGDP
3.233 [0.19]
√√ √√
8.544 [0.01]
0.319 [0.85]
6.225 [0.05]
FDI
6.336 [0.04]
2.884 [0.24]
√√ √√
1.532 [0.46]
5.866 [0.05]
LEU
0.605 [0.74]
6.069 [0.05]
4.507 [0.11]
√√ √√
8.825 [0.01]
LAGR
1.337 [0.51]
0.959 [0.61]
6.062 [0.05]
9.011 [0.01]
√√ √√
Note Bolden figures in brackets are the prob. that represent 10%, 5%, and 1% significance resp.
while the figures before the brackets are the Chi-squares (χ 2 ) = Chi-squares (χ 2 ) [p-values]
E. N. Udemba
4.4 Diagnostic Tests (Cumulative Sum and Cumulative Sum
Square, CUSUM and CUSM 2 )
-16
-12
-8
-4
0
4
8
12
16
90 92 94 96 98 00 02 04 06 08 10 12 14 16
CUSUM
5% Significance
-0.4
-0.2
0.0
0.2
0.4
0.6
0.8
1.0
1.2
1.4
90 92 94 96 98 00 02 04 06 08 10 12 14 16
CUSUM of Squares
5% Significance
5 Granger Causality Analysis (VECM)
Author applied causality analysis to test forecasting power of the selected variables
which will also act as robust check to the findings of short- and long-run cointegration
estimations. The linear and quadratic estimations of the ARDL might not give detail
insight on the relationships that exist among the variables. Positive and negative
interactions of the selected variables are possible without ascertaining the inducer
and the direction of the relationship among the variables if granger causality is
not considered. For a valid interpretation of the relationship that existed among
the variables with forecasting ability, the current study has undertaken the granger
causality analysis. Because of the mixed order of integration among the variables,
VAR granger causality/block exogeneity was applied, and the outcome is shown
in Table 4. From the result, one-way direction causality is found transmitting from
energy use to economic growth, from economic growth to FDI and from economic
growth to agriculture. Also, two-way causal transmission is found between FDI and
ecological footprint, between agriculture and energy use, and between agriculture
Table 4 VECM granger causality analysis/block exogeneity wald tests
Variables
LGDP
FDI
LEU
LAGR
LEFP
√√ √√
3.299 [0.19]
5.123 [0.08]
1.265 [0.53]
4.094 [0.53]
LGDP
3.233 [0.19]
√√ √√
8.544 [0.01]
0.319 [0.85]
6.225 [0.05]
FDI
6.336 [0.04]
2.884 [0.24]
√√ √√
1.532 [0.46]
5.866 [0.05]
LEU
0.605 [0.74]
6.069 [0.05]
4.507 [0.11]
√√ √√
8.825 [0.01]
LAGR
1.337 [0.51]
0.959 [0.61]
6.062 [0.05]
9.011 [0.01]
√√ √√
Note Bolden figures in brackets are the prob. that represent 10%, 5%, and 1% significance resp.
while the figures before the brackets are the Chi-squares (χ 2 ) = Chi-squares (χ 2 ) [p-values]