

Pakistan Ecological Footprint and Major Driving Forces …
113
utilized for cointegration testing in determination of the possibility of long-run relationship among the variables. Diagnostic tests such as test for serial correlation and
heteroscedasticity, cumulative sum square (CUSUM and CUSUM
2 ) were all utilized
in robust checking of the findings from other approaches. Also, granger causality
(VECM block exogeneity) was equally adopted in complementing the linear and
nonlinear relationship that exist among the variables in both short run and long run.
It (granger causality) was specifically applied to ascertain if there the variables and
their lags establish forecasting ability among themselves.
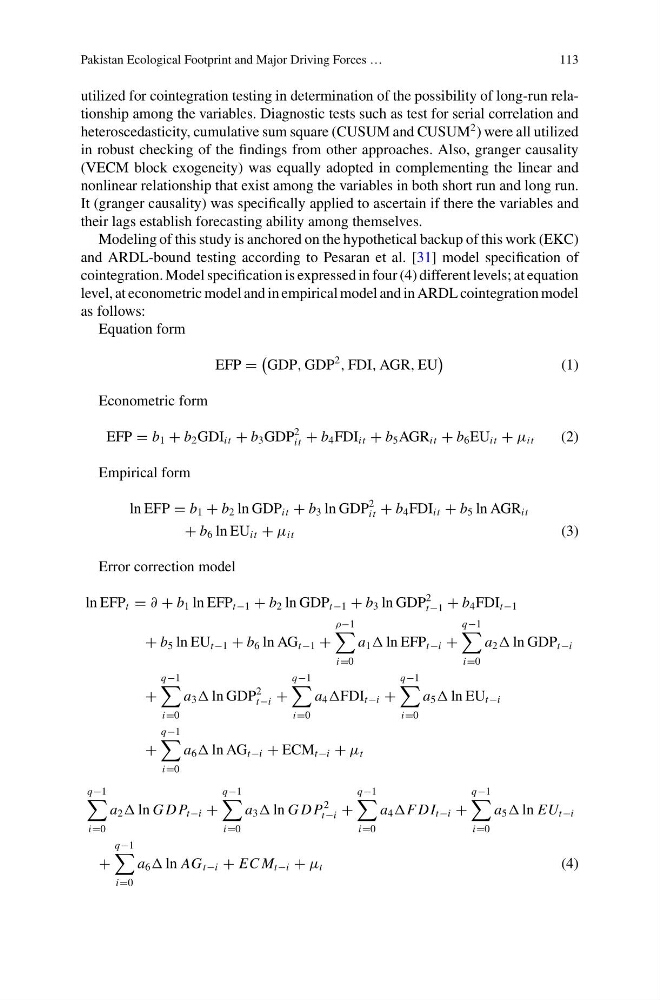
Modeling of this study is anchored on the hypothetical backup of this work (EKC)
and ARDL-bound testing according to Pesaran et al. [31] model specification of
cointegration. Model specification is expressed in four (4) different levels; at equation
level, at econometric model and in empirical model and in ARDL cointegration model
as follows:
Equation form
EFP =
GDP, GDP
2
, FDI, AGR, EU
(1)
Econometric form
EFP = b 1 + b 2 GDI it + b 3 GDP
2
it + b 4 FDI it + b 5 AGR it + b 6 EU it + μ it
(2)
Empirical form
ln EFP = b 1 + b 2 ln GDP it + b 3 ln GDP
2
it + b 4 FDI it + b 5 ln AGR it
+ b 6 ln EU it + μ it
(3)
Error correction model
ln EFP t = ∂ + b 1 ln EFP t−1 + b 2 ln GDP t−1 + b 3 ln GDP
2
t−1 + b 4 FDI t−1
+ b 5 ln EU t−1 + b 6 ln AG t−1 +
ρ−1
i=0
a 1 ln EFP t−i +
q−1
i=0
a 2 ln GDP t−i
+
q−1
i=0
a 3 ln GDP
2
t−i +
q−1
i=0
a 4 FDI t−i +
q−1
i=0
a 5 ln EU t−i
+
q−1
i=0
a 6 ln AG t−i + ECM t−i + μ t
q−1
i=0
a 2 ln G D P t−i +
q−1
i=0
a 3 ln G D P
2
t−i +
q−1
i=0
a 4 F DI t−i +
q−1
i=0
a 5 ln EU t−i
+
q−1
i=0
a 6 ln AG t−i + EC M t−i + μ t
(4)
113
utilized for cointegration testing in determination of the possibility of long-run relationship among the variables. Diagnostic tests such as test for serial correlation and
heteroscedasticity, cumulative sum square (CUSUM and CUSUM
2 ) were all utilized
in robust checking of the findings from other approaches. Also, granger causality
(VECM block exogeneity) was equally adopted in complementing the linear and
nonlinear relationship that exist among the variables in both short run and long run.
It (granger causality) was specifically applied to ascertain if there the variables and
their lags establish forecasting ability among themselves.
Modeling of this study is anchored on the hypothetical backup of this work (EKC)
and ARDL-bound testing according to Pesaran et al. [31] model specification of
cointegration. Model specification is expressed in four (4) different levels; at equation
level, at econometric model and in empirical model and in ARDL cointegration model
as follows:
Equation form
EFP =
GDP, GDP
2
, FDI, AGR, EU
(1)
Econometric form
EFP = b 1 + b 2 GDI it + b 3 GDP
2
it + b 4 FDI it + b 5 AGR it + b 6 EU it + μ it
(2)
Empirical form
ln EFP = b 1 + b 2 ln GDP it + b 3 ln GDP
2
it + b 4 FDI it + b 5 ln AGR it
+ b 6 ln EU it + μ it
(3)
Error correction model
ln EFP t = ∂ + b 1 ln EFP t−1 + b 2 ln GDP t−1 + b 3 ln GDP
2
t−1 + b 4 FDI t−1
+ b 5 ln EU t−1 + b 6 ln AG t−1 +
ρ−1
i=0
a 1 ln EFP t−i +
q−1
i=0
a 2 ln GDP t−i
+
q−1
i=0
a 3 ln GDP
2
t−i +
q−1
i=0
a 4 FDI t−i +
q−1
i=0
a 5 ln EU t−i
+
q−1
i=0
a 6 ln AG t−i + ECM t−i + μ t
q−1
i=0
a 2 ln G D P t−i +
q−1
i=0
a 3 ln G D P
2
t−i +
q−1
i=0
a 4 F DI t−i +
q−1
i=0
a 5 ln EU t−i
+
q−1
i=0
a 6 ln AG t−i + EC M t−i + μ t
(4)