

Hydrogeophysical Investigations Using DC Resistivity …
269
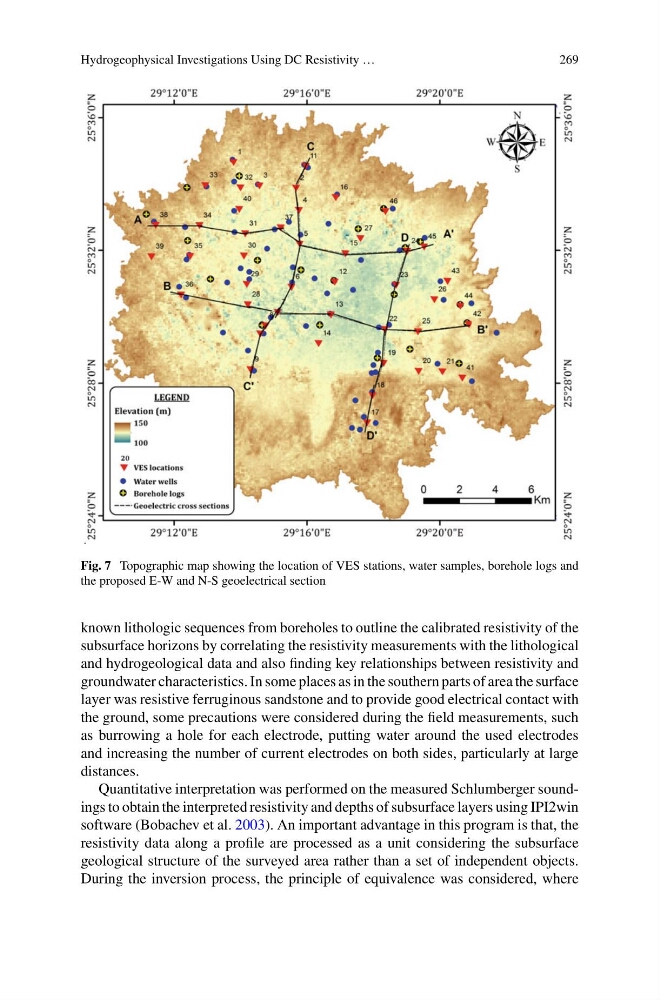
Fig. 7 Topographic map showing the location of VES stations, water samples, borehole logs and
the proposed E-W and N-S geoelectrical section
known lithologic sequences from boreholes to outline the calibrated resistivity of the
subsurface horizons by correlating the resistivity measurements with the lithological
and hydrogeological data and also finding key relationships between resistivity and
groundwater characteristics. In some places as in the southern parts of area the surface
layer was resistive ferruginous sandstone and to provide good electrical contact with
the ground, some precautions were considered during the field measurements, such
as burrowing a hole for each electrode, putting water around the used electrodes
and increasing the number of current electrodes on both sides, particularly at large
distances.
Quantitative interpretation was performed on the measured Schlumberger soundings to obtain the interpreted resistivity and depths of subsurface layers using IPI2win
software (Bobachev et al. 2003). An important advantage in this program is that, the
resistivity data along a profile are processed as a unit considering the subsurface
geological structure of the surveyed area rather than a set of independent objects.
During the inversion process, the principle of equivalence was considered, where
269
Fig. 7 Topographic map showing the location of VES stations, water samples, borehole logs and
the proposed E-W and N-S geoelectrical section
known lithologic sequences from boreholes to outline the calibrated resistivity of the
subsurface horizons by correlating the resistivity measurements with the lithological
and hydrogeological data and also finding key relationships between resistivity and
groundwater characteristics. In some places as in the southern parts of area the surface
layer was resistive ferruginous sandstone and to provide good electrical contact with
the ground, some precautions were considered during the field measurements, such
as burrowing a hole for each electrode, putting water around the used electrodes
and increasing the number of current electrodes on both sides, particularly at large
distances.
Quantitative interpretation was performed on the measured Schlumberger soundings to obtain the interpreted resistivity and depths of subsurface layers using IPI2win
software (Bobachev et al. 2003). An important advantage in this program is that, the
resistivity data along a profile are processed as a unit considering the subsurface
geological structure of the surveyed area rather than a set of independent objects.
During the inversion process, the principle of equivalence was considered, where