

234
E. Iwasaki et al.
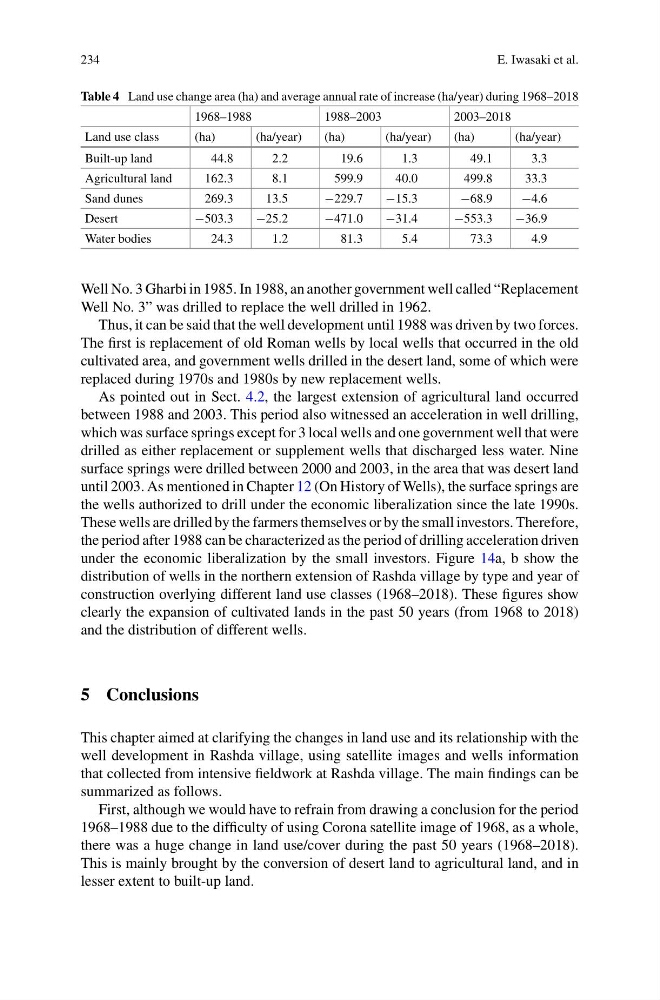
Table 4 Land use change area (ha) and average annual rate of increase (ha/year) during 1968–2018
1968–1988
1988–2003
2003–2018
Land use class
(ha)
(ha/year)
(ha)
(ha/year)
(ha)
(ha/year)
Built-up land
44.8
2.2
19.6
1.3
49.1
3.3
Agricultural land
162.3
8.1
599.9
40.0
499.8
33.3
Sand dunes
269.3
13.5
−229.7
−15.3
−68.9
−4.6
Desert
−503.3
−25.2
−471.0
−31.4
−553.3
−36.9
Water bodies
24.3
1.2
81.3
5.4
73.3
4.9
Well No. 3 Gharbi in 1985. In 1988, an another government well called “Replacement
Well No. 3” was drilled to replace the well drilled in 1962.
Thus, it can be said that the well development until 1988 was driven by two forces.
The first is replacement of old Roman wells by local wells that occurred in the old
cultivated area, and government wells drilled in the desert land, some of which were
replaced during 1970s and 1980s by new replacement wells.
As pointed out in Sect. 4.2, the largest extension of agricultural land occurred
between 1988 and 2003. This period also witnessed an acceleration in well drilling,
which was surface springs except for 3 local wells and one government well that were
drilled as either replacement or supplement wells that discharged less water. Nine
surface springs were drilled between 2000 and 2003, in the area that was desert land
until 2003. As mentioned in Chapter 12 (On History of Wells), the surface springs are
the wells authorized to drill under the economic liberalization since the late 1990s.
These wells are drilled by the farmers themselves or by the small investors. Therefore,
the period after 1988 can be characterized as the period of drilling acceleration driven
under the economic liberalization by the small investors. Figure 14a, b show the
distribution of wells in the northern extension of Rashda village by type and year of
construction overlying different land use classes (1968–2018). These figures show
clearly the expansion of cultivated lands in the past 50 years (from 1968 to 2018)
and the distribution of different wells.
5 Conclusions
This chapter aimed at clarifying the changes in land use and its relationship with the
well development in Rashda village, using satellite images and wells information
that collected from intensive fieldwork at Rashda village. The main findings can be
summarized as follows.
First, although we would have to refrain from drawing a conclusion for the period
1968–1988 due to the difficulty of using Corona satellite image of 1968, as a whole,
there was a huge change in land use/cover during the past 50 years (1968–2018).
This is mainly brought by the conversion of desert land to agricultural land, and in
lesser extent to built-up land.
E. Iwasaki et al.
Table 4 Land use change area (ha) and average annual rate of increase (ha/year) during 1968–2018
1968–1988
1988–2003
2003–2018
Land use class
(ha)
(ha/year)
(ha)
(ha/year)
(ha)
(ha/year)
Built-up land
44.8
2.2
19.6
1.3
49.1
3.3
Agricultural land
162.3
8.1
599.9
40.0
499.8
33.3
Sand dunes
269.3
13.5
−229.7
−15.3
−68.9
−4.6
Desert
−503.3
−25.2
−471.0
−31.4
−553.3
−36.9
Water bodies
24.3
1.2
81.3
5.4
73.3
4.9
Well No. 3 Gharbi in 1985. In 1988, an another government well called “Replacement
Well No. 3” was drilled to replace the well drilled in 1962.
Thus, it can be said that the well development until 1988 was driven by two forces.
The first is replacement of old Roman wells by local wells that occurred in the old
cultivated area, and government wells drilled in the desert land, some of which were
replaced during 1970s and 1980s by new replacement wells.
As pointed out in Sect. 4.2, the largest extension of agricultural land occurred
between 1988 and 2003. This period also witnessed an acceleration in well drilling,
which was surface springs except for 3 local wells and one government well that were
drilled as either replacement or supplement wells that discharged less water. Nine
surface springs were drilled between 2000 and 2003, in the area that was desert land
until 2003. As mentioned in Chapter 12 (On History of Wells), the surface springs are
the wells authorized to drill under the economic liberalization since the late 1990s.
These wells are drilled by the farmers themselves or by the small investors. Therefore,
the period after 1988 can be characterized as the period of drilling acceleration driven
under the economic liberalization by the small investors. Figure 14a, b show the
distribution of wells in the northern extension of Rashda village by type and year of
construction overlying different land use classes (1968–2018). These figures show
clearly the expansion of cultivated lands in the past 50 years (from 1968 to 2018)
and the distribution of different wells.
5 Conclusions
This chapter aimed at clarifying the changes in land use and its relationship with the
well development in Rashda village, using satellite images and wells information
that collected from intensive fieldwork at Rashda village. The main findings can be
summarized as follows.
First, although we would have to refrain from drawing a conclusion for the period
1968–1988 due to the difficulty of using Corona satellite image of 1968, as a whole,
there was a huge change in land use/cover during the past 50 years (1968–2018).
This is mainly brought by the conversion of desert land to agricultural land, and in
lesser extent to built-up land.