

Hydrologeological and Hydrological …
191
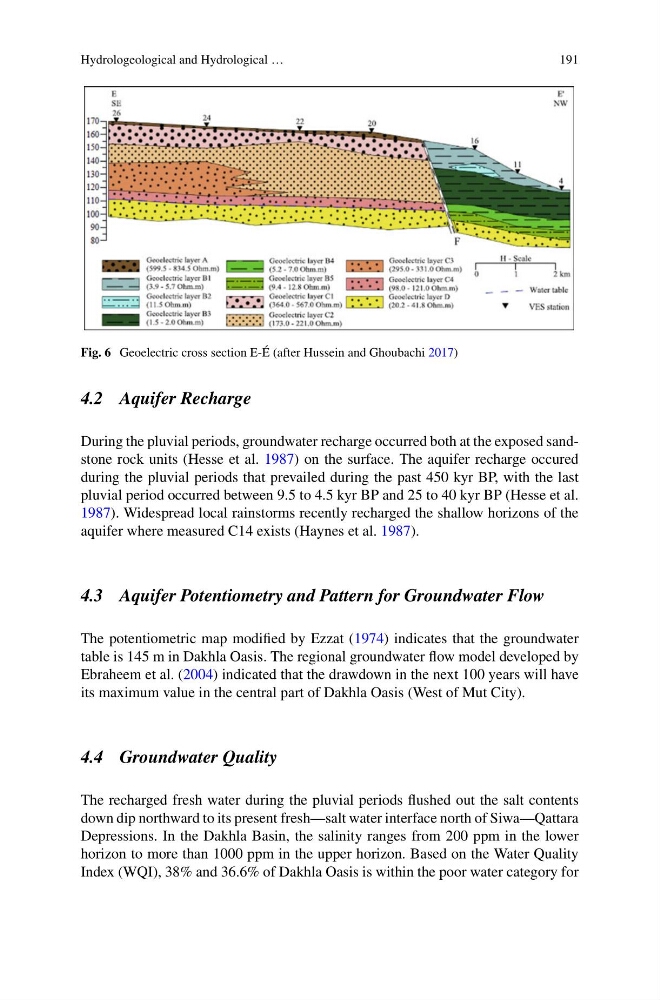
Fig. 6 Geoelectric cross section E-É (after Hussein and Ghoubachi 2017)
4.2 Aquifer Recharge
During the pluvial periods, groundwater recharge occurred both at the exposed sandstone rock units (Hesse et al. 1987) on the surface. The aquifer recharge occured
during the pluvial periods that prevailed during the past 450 kyr BP, with the last
pluvial period occurred between 9.5 to 4.5 kyr BP and 25 to 40 kyr BP (Hesse et al.
1987). Widespread local rainstorms recently recharged the shallow horizons of the
aquifer where measured C14 exists (Haynes et al. 1987).
4.3 Aquifer Potentiometry and Pattern for Groundwater Flow
The potentiometric map modified by Ezzat (1974) indicates that the groundwater
table is 145 m in Dakhla Oasis. The regional groundwater flow model developed by
Ebraheem et al. (2004) indicated that the drawdown in the next 100 years will have
its maximum value in the central part of Dakhla Oasis (West of Mut City).
4.4 Groundwater Quality
The recharged fresh water during the pluvial periods flushed out the salt contents
down dip northward to its present fresh—salt water interface north of Siwa—Qattara
Depressions. In the Dakhla Basin, the salinity ranges from 200 ppm in the lower
horizon to more than 1000 ppm in the upper horizon. Based on the Water Quality
Index (WQI), 38% and 36.6% of Dakhla Oasis is within the poor water category for
191
Fig. 6 Geoelectric cross section E-É (after Hussein and Ghoubachi 2017)
4.2 Aquifer Recharge
During the pluvial periods, groundwater recharge occurred both at the exposed sandstone rock units (Hesse et al. 1987) on the surface. The aquifer recharge occured
during the pluvial periods that prevailed during the past 450 kyr BP, with the last
pluvial period occurred between 9.5 to 4.5 kyr BP and 25 to 40 kyr BP (Hesse et al.
1987). Widespread local rainstorms recently recharged the shallow horizons of the
aquifer where measured C14 exists (Haynes et al. 1987).
4.3 Aquifer Potentiometry and Pattern for Groundwater Flow
The potentiometric map modified by Ezzat (1974) indicates that the groundwater
table is 145 m in Dakhla Oasis. The regional groundwater flow model developed by
Ebraheem et al. (2004) indicated that the drawdown in the next 100 years will have
its maximum value in the central part of Dakhla Oasis (West of Mut City).
4.4 Groundwater Quality
The recharged fresh water during the pluvial periods flushed out the salt contents
down dip northward to its present fresh—salt water interface north of Siwa—Qattara
Depressions. In the Dakhla Basin, the salinity ranges from 200 ppm in the lower
horizon to more than 1000 ppm in the upper horizon. Based on the Water Quality
Index (WQI), 38% and 36.6% of Dakhla Oasis is within the poor water category for