

5 Assessment of Groundwater Quality in Sri Lanka …
127
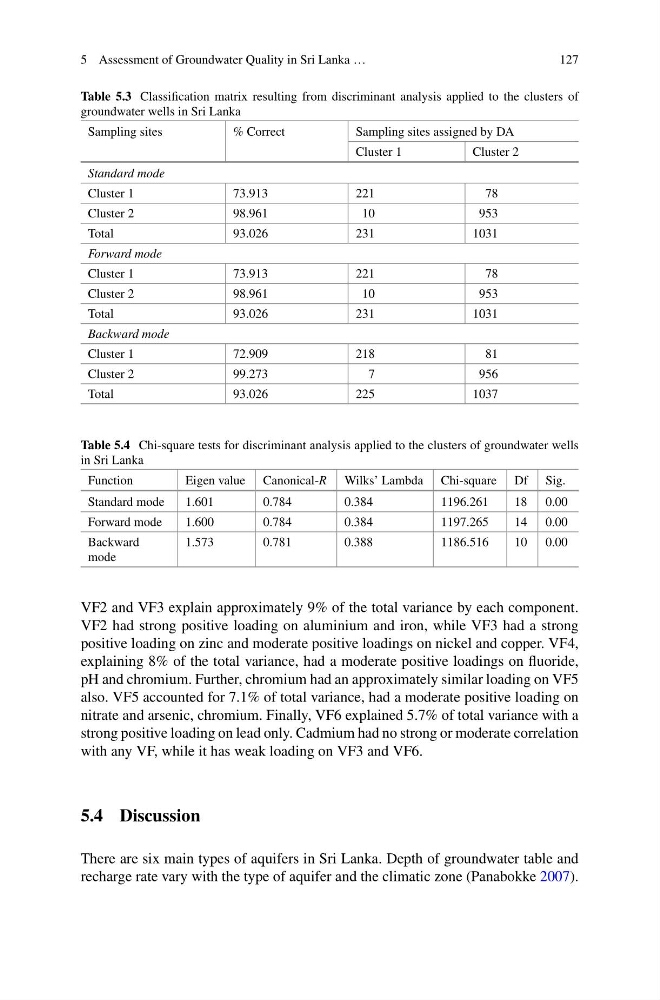
Table 5.3 Classification matrix resulting from discriminant analysis applied to the clusters of
groundwater wells in Sri Lanka
Sampling sites
% Correct
Sampling sites assigned by DA
Cluster 1
Cluster 2
Standard mode
Cluster 1
73.913
221
78
Cluster 2
98.961
10
953
Total
93.026
231
1031
Forward mode
Cluster 1
73.913
221
78
Cluster 2
98.961
10
953
Total
93.026
231
1031
Backward mode
Cluster 1
72.909
218
81
Cluster 2
99.273
7
956
Total
93.026
225
1037
Table 5.4 Chi-square tests for discriminant analysis applied to the clusters of groundwater wells
in Sri Lanka
Function
Eigen value Canonical-R Wilks’ Lambda Chi-square Df Sig.
Standard mode
1.601
0.784
0.384
1196.261
18 0.00
Forward mode
1.600
0.784
0.384
1197.265
14 0.00
Backward
mode
1.573
0.781
0.388
1186.516
10 0.00
VF2 and VF3 explain approximately 9% of the total variance by each component.
VF2 had strong positive loading on aluminium and iron, while VF3 had a strong
positive loading on zinc and moderate positive loadings on nickel and copper. VF4,
explaining 8% of the total variance, had a moderate positive loadings on fluoride,
pH and chromium. Further, chromium had an approximately similar loading on VF5
also. VF5 accounted for 7.1% of total variance, had a moderate positive loading on
nitrate and arsenic, chromium. Finally, VF6 explained 5.7% of total variance with a
strong positive loading on lead only. Cadmium had no strong or moderate correlation
with any VF, while it has weak loading on VF3 and VF6.
5.4 Discussion
There are six main types of aquifers in Sri Lanka. Depth of groundwater table and
recharge rate vary with the type of aquifer and the climatic zone (Panabokke 2007).
127
Table 5.3 Classification matrix resulting from discriminant analysis applied to the clusters of
groundwater wells in Sri Lanka
Sampling sites
% Correct
Sampling sites assigned by DA
Cluster 1
Cluster 2
Standard mode
Cluster 1
73.913
221
78
Cluster 2
98.961
10
953
Total
93.026
231
1031
Forward mode
Cluster 1
73.913
221
78
Cluster 2
98.961
10
953
Total
93.026
231
1031
Backward mode
Cluster 1
72.909
218
81
Cluster 2
99.273
7
956
Total
93.026
225
1037
Table 5.4 Chi-square tests for discriminant analysis applied to the clusters of groundwater wells
in Sri Lanka
Function
Eigen value Canonical-R Wilks’ Lambda Chi-square Df Sig.
Standard mode
1.601
0.784
0.384
1196.261
18 0.00
Forward mode
1.600
0.784
0.384
1197.265
14 0.00
Backward
mode
1.573
0.781
0.388
1186.516
10 0.00
VF2 and VF3 explain approximately 9% of the total variance by each component.
VF2 had strong positive loading on aluminium and iron, while VF3 had a strong
positive loading on zinc and moderate positive loadings on nickel and copper. VF4,
explaining 8% of the total variance, had a moderate positive loadings on fluoride,
pH and chromium. Further, chromium had an approximately similar loading on VF5
also. VF5 accounted for 7.1% of total variance, had a moderate positive loading on
nitrate and arsenic, chromium. Finally, VF6 explained 5.7% of total variance with a
strong positive loading on lead only. Cadmium had no strong or moderate correlation
with any VF, while it has weak loading on VF3 and VF6.
5.4 Discussion
There are six main types of aquifers in Sri Lanka. Depth of groundwater table and
recharge rate vary with the type of aquifer and the climatic zone (Panabokke 2007).