

5 Assessment of Groundwater Quality in Sri Lanka …
123
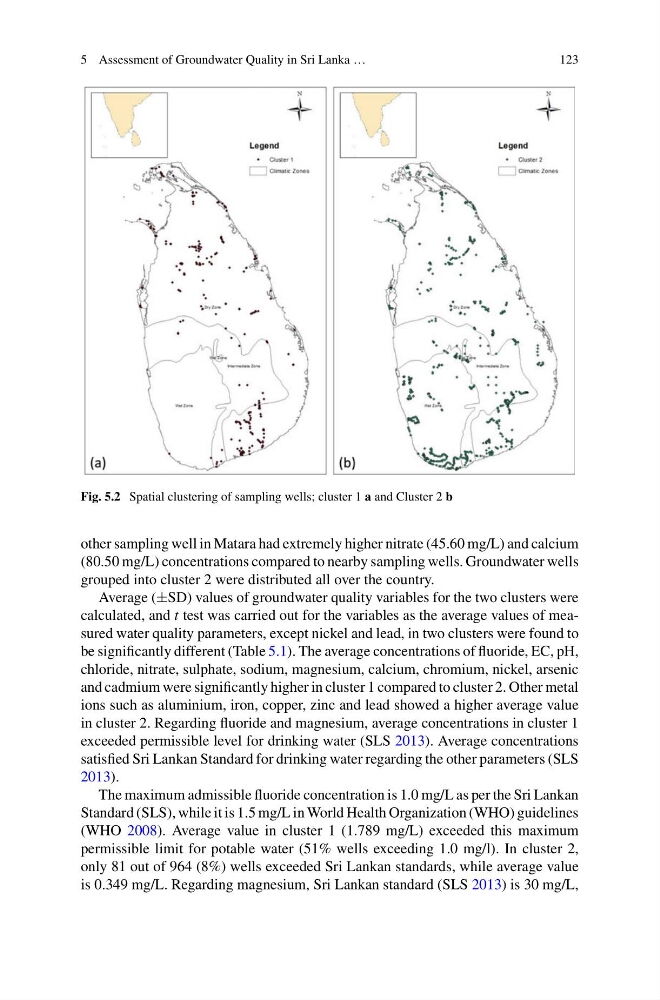
Fig. 5.2 Spatial clustering of sampling wells; cluster 1 a and Cluster 2 b
other sampling well in Matara had extremely higher nitrate (45.60 mg/L) and calcium
(80.50 mg/L) concentrations compared to nearby sampling wells. Groundwater wells
grouped into cluster 2 were distributed all over the country.
Average (±SD) values of groundwater quality variables for the two clusters were
calculated, and t test was carried out for the variables as the average values of measured water quality parameters, except nickel and lead, in two clusters were found to
be significantly different (Table 5.1). The average concentrations of fluoride, EC, pH,
chloride, nitrate, sulphate, sodium, magnesium, calcium, chromium, nickel, arsenic
and cadmium were significantly higher in cluster 1 compared to cluster 2. Other metal
ions such as aluminium, iron, copper, zinc and lead showed a higher average value
in cluster 2. Regarding fluoride and magnesium, average concentrations in cluster 1
exceeded permissible level for drinking water (SLS 2013). Average concentrations
satisfied Sri Lankan Standard for drinking water regarding the other parameters (SLS
2013).
The maximum admissible fluoride concentration is 1.0 mg/L as per the Sri Lankan
Standard (SLS), while it is 1.5 mg/L in World Health Organization (WHO) guidelines
(WHO 2008). Average value in cluster 1 (1.789 mg/L) exceeded this maximum
permissible limit for potable water (51% wells exceeding 1.0 mg/l). In cluster 2,
only 81 out of 964 (8%) wells exceeded Sri Lankan standards, while average value
is 0.349 mg/L. Regarding magnesium, Sri Lankan standard (SLS 2013) is 30 mg/L,
123
Fig. 5.2 Spatial clustering of sampling wells; cluster 1 a and Cluster 2 b
other sampling well in Matara had extremely higher nitrate (45.60 mg/L) and calcium
(80.50 mg/L) concentrations compared to nearby sampling wells. Groundwater wells
grouped into cluster 2 were distributed all over the country.
Average (±SD) values of groundwater quality variables for the two clusters were
calculated, and t test was carried out for the variables as the average values of measured water quality parameters, except nickel and lead, in two clusters were found to
be significantly different (Table 5.1). The average concentrations of fluoride, EC, pH,
chloride, nitrate, sulphate, sodium, magnesium, calcium, chromium, nickel, arsenic
and cadmium were significantly higher in cluster 1 compared to cluster 2. Other metal
ions such as aluminium, iron, copper, zinc and lead showed a higher average value
in cluster 2. Regarding fluoride and magnesium, average concentrations in cluster 1
exceeded permissible level for drinking water (SLS 2013). Average concentrations
satisfied Sri Lankan Standard for drinking water regarding the other parameters (SLS
2013).
The maximum admissible fluoride concentration is 1.0 mg/L as per the Sri Lankan
Standard (SLS), while it is 1.5 mg/L in World Health Organization (WHO) guidelines
(WHO 2008). Average value in cluster 1 (1.789 mg/L) exceeded this maximum
permissible limit for potable water (51% wells exceeding 1.0 mg/l). In cluster 2,
only 81 out of 964 (8%) wells exceeded Sri Lankan standards, while average value
is 0.349 mg/L. Regarding magnesium, Sri Lankan standard (SLS 2013) is 30 mg/L,