

84
S. Mohapatra et al.
the presence of Suwannee River fulvic acid acting as an inner filter. The inhibition of E3 photolysis under elevated light intensity was attributed to the photoactivated humic acid species being more efficient free radical quenchers compared to
the parent humic acids (Chen et al. 2013). Other ions, such as nitrate, nitrite, and
bicarbonate, may also affect the photolytic pathway of steroids. It was observed
that the presence of HCO 3
− ions decreased the rate of photolytic removal of E2
as these acted as quenchers of OH
• radicals, while the presence of NO 3
− and NO 2
−
ions significantly increased the generation of OH
• radicals, thereby increasing the
rate of removal of E2 (Liu et al. 2017).
The pH of water affected the rate of photolysis of E1 (0.15 h
−1 ), E2 (0.02 h
−1 ), E3
(0.02 h
−1 ), and EE2 (0.02 h
−1 ). Photolysis rate was low below pH 6 and increased
gradually up to pH 9. An increase in pH increased the generation of OH
− ions, which
in turn created more OH
• radicals that facilitated photolysis. Greater removal efficiency was observed above the pKa values of the estrogens, which is ~ 10.5 for E1,
E2, E3, and EE2. As pH increased beyond the pKa, more of the estrogens excited
as negatively charged species. Therefore, electrophilic attack by reactive oxygen
species resulted in further degradation of the estrogens (Sornalingam et al. 2016).
The above trend was also observed by Chen et al. (2013) for E3 phototransformation, which slightly increased with a rise in pH from 6.0 to 8.0 and rapidly increased
over the pH range 8 and 10. However, while pH played an important role in determining the photolytic removal of estrogenic steroids, pH had negligible effect on
the direct and indirect photolysis of testosterone in spiked surface water samples
(Vulliet et al. 2010).
3.3 Modeling of Natural Attenuation
Aymerich et al. (2016) determined the attenuation rate of several pharmaceuticals and
their metabolites in a river assuming the river behaved as a plug-flow reactor. Further,
they included expressions for lateral flow in the plug-flow reactor to better simulate
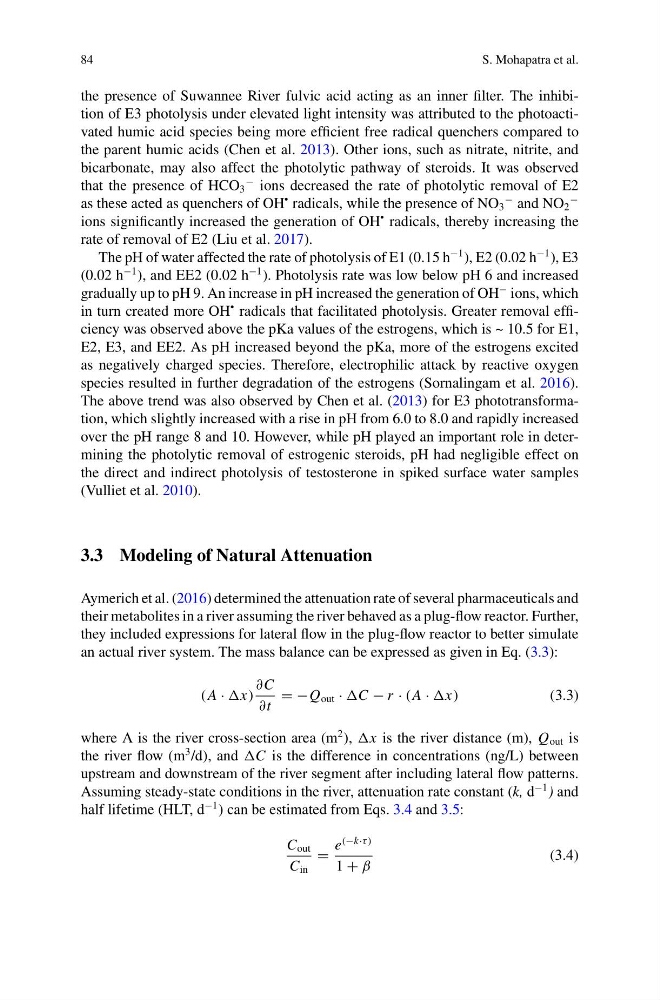
an actual river system. The mass balance can be expressed as given in Eq. (3.3):
(A · x)
∂C
∂t
= −Q out · C − r · (A · x)
(3.3)
where A is the river cross-section area (m
2 ), x is the river distance (m), Q out is
the river flow (m
3 /d), and C is the difference in concentrations (ng/L) between
upstream and downstream of the river segment after including lateral flow patterns.
Assuming steady-state conditions in the river, attenuation rate constant (k, d
−1 ) and
half lifetime (HLT, d
−1 ) can be estimated from Eqs. 3.4 and 3.5:
C out
C in
=
e
(−k·τ )
1 + β
(3.4)
S. Mohapatra et al.
the presence of Suwannee River fulvic acid acting as an inner filter. The inhibition of E3 photolysis under elevated light intensity was attributed to the photoactivated humic acid species being more efficient free radical quenchers compared to
the parent humic acids (Chen et al. 2013). Other ions, such as nitrate, nitrite, and
bicarbonate, may also affect the photolytic pathway of steroids. It was observed
that the presence of HCO 3
− ions decreased the rate of photolytic removal of E2
as these acted as quenchers of OH
• radicals, while the presence of NO 3
− and NO 2
−
ions significantly increased the generation of OH
• radicals, thereby increasing the
rate of removal of E2 (Liu et al. 2017).
The pH of water affected the rate of photolysis of E1 (0.15 h
−1 ), E2 (0.02 h
−1 ), E3
(0.02 h
−1 ), and EE2 (0.02 h
−1 ). Photolysis rate was low below pH 6 and increased
gradually up to pH 9. An increase in pH increased the generation of OH
− ions, which
in turn created more OH
• radicals that facilitated photolysis. Greater removal efficiency was observed above the pKa values of the estrogens, which is ~ 10.5 for E1,
E2, E3, and EE2. As pH increased beyond the pKa, more of the estrogens excited
as negatively charged species. Therefore, electrophilic attack by reactive oxygen
species resulted in further degradation of the estrogens (Sornalingam et al. 2016).
The above trend was also observed by Chen et al. (2013) for E3 phototransformation, which slightly increased with a rise in pH from 6.0 to 8.0 and rapidly increased
over the pH range 8 and 10. However, while pH played an important role in determining the photolytic removal of estrogenic steroids, pH had negligible effect on
the direct and indirect photolysis of testosterone in spiked surface water samples
(Vulliet et al. 2010).
3.3 Modeling of Natural Attenuation
Aymerich et al. (2016) determined the attenuation rate of several pharmaceuticals and
their metabolites in a river assuming the river behaved as a plug-flow reactor. Further,
they included expressions for lateral flow in the plug-flow reactor to better simulate
an actual river system. The mass balance can be expressed as given in Eq. (3.3):
(A · x)
∂C
∂t
= −Q out · C − r · (A · x)
(3.3)
where A is the river cross-section area (m
2 ), x is the river distance (m), Q out is
the river flow (m
3 /d), and C is the difference in concentrations (ng/L) between
upstream and downstream of the river segment after including lateral flow patterns.
Assuming steady-state conditions in the river, attenuation rate constant (k, d
−1 ) and
half lifetime (HLT, d
−1 ) can be estimated from Eqs. 3.4 and 3.5:
C out
C in
=
e
(−k·τ )
1 + β
(3.4)