

3 New Trends and Drivers for Agricultural Land Use in Germany
41
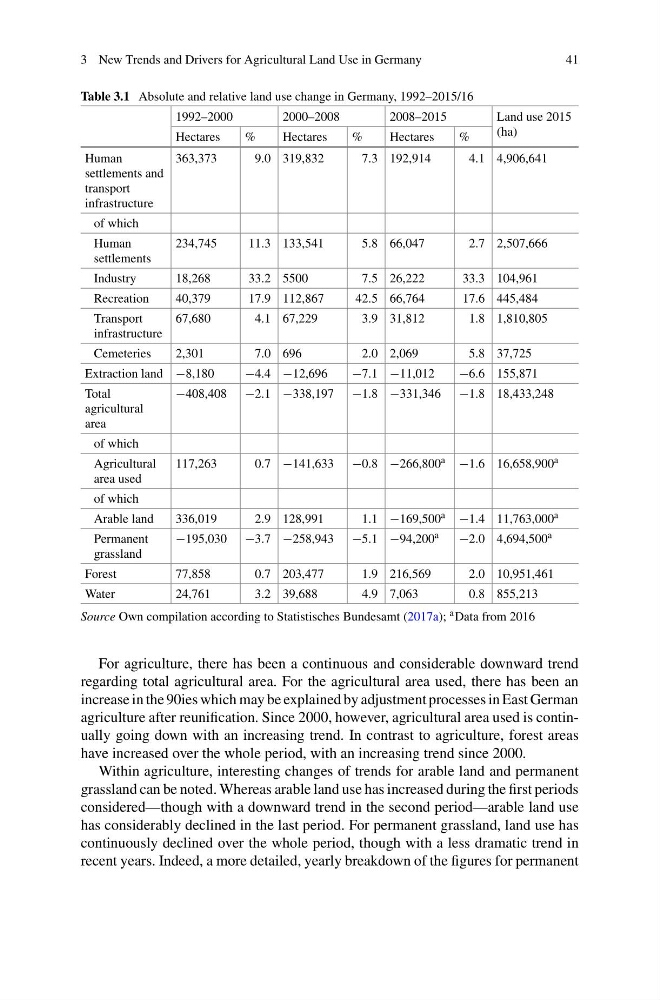
Table 3.1 Absolute and relative land use change in Germany, 1992–2015/16
1992–2000
2000–2008
2008–2015
Land use 2015
(ha)
Hectares
%
Hectares
%
Hectares
%
Human
settlements and
transport
infrastructure
363,373
9.0 319,832
7.3 192,914
4.1 4,906,641
of which
Human
settlements
234,745
11.3 133,541
5.8 66,047
2.7 2,507,666
Industry
18,268
33.2 5500
7.5 26,222
33.3 104,961
Recreation
40,379
17.9 112,867
42.5 66,764
17.6 445,484
Transport
infrastructure
67,680
4.1 67,229
3.9 31,812
1.8 1,810,805
Cemeteries
2,301
7.0 696
2.0 2,069
5.8 37,725
Extraction land −8,180
−4.4 −12,696
−7.1 −11,012
−6.6 155,871
Total
agricultural
area
−408,408 −2.1 −338,197 −1.8 −331,346 −1.8 18,433,248
of which
Agricultural
area used
117,263
0.7 −141,633 −0.8 −266,800 a −1.6 16,658,900 a
of which
Arable land
336,019
2.9 128,991
1.1 −169,500 a −1.4 11,763,000 a
Permanent
grassland
−195,030 −3.7 −258,943 −5.1 −94,200 a
−2.0 4,694,500 a
Forest
77,858
0.7 203,477
1.9 216,569
2.0 10,951,461
Water
24,761
3.2 39,688
4.9 7,063
0.8 855,213
Source Own compilation according to Statistisches Bundesamt (2017a); a Data from 2016
For agriculture, there has been a continuous and considerable downward trend
regarding total agricultural area. For the agricultural area used, there has been an
increase in the 90ies which may be explained by adjustment processes in East German
agriculture after reunification. Since 2000, however, agricultural area used is continually going down with an increasing trend. In contrast to agriculture, forest areas
have increased over the whole period, with an increasing trend since 2000.
Within agriculture, interesting changes of trends for arable land and permanent
grassland can be noted. Whereas arable land use has increased during the first periods
considered—though with a downward trend in the second period—arable land use
has considerably declined in the last period. For permanent grassland, land use has
continuously declined over the whole period, though with a less dramatic trend in
recent years. Indeed, a more detailed, yearly breakdown of the figures for permanent
41
Table 3.1 Absolute and relative land use change in Germany, 1992–2015/16
1992–2000
2000–2008
2008–2015
Land use 2015
(ha)
Hectares
%
Hectares
%
Hectares
%
Human
settlements and
transport
infrastructure
363,373
9.0 319,832
7.3 192,914
4.1 4,906,641
of which
Human
settlements
234,745
11.3 133,541
5.8 66,047
2.7 2,507,666
Industry
18,268
33.2 5500
7.5 26,222
33.3 104,961
Recreation
40,379
17.9 112,867
42.5 66,764
17.6 445,484
Transport
infrastructure
67,680
4.1 67,229
3.9 31,812
1.8 1,810,805
Cemeteries
2,301
7.0 696
2.0 2,069
5.8 37,725
Extraction land −8,180
−4.4 −12,696
−7.1 −11,012
−6.6 155,871
Total
agricultural
area
−408,408 −2.1 −338,197 −1.8 −331,346 −1.8 18,433,248
of which
Agricultural
area used
117,263
0.7 −141,633 −0.8 −266,800 a −1.6 16,658,900 a
of which
Arable land
336,019
2.9 128,991
1.1 −169,500 a −1.4 11,763,000 a
Permanent
grassland
−195,030 −3.7 −258,943 −5.1 −94,200 a
−2.0 4,694,500 a
Forest
77,858
0.7 203,477
1.9 216,569
2.0 10,951,461
Water
24,761
3.2 39,688
4.9 7,063
0.8 855,213
Source Own compilation according to Statistisches Bundesamt (2017a); a Data from 2016
For agriculture, there has been a continuous and considerable downward trend
regarding total agricultural area. For the agricultural area used, there has been an
increase in the 90ies which may be explained by adjustment processes in East German
agriculture after reunification. Since 2000, however, agricultural area used is continually going down with an increasing trend. In contrast to agriculture, forest areas
have increased over the whole period, with an increasing trend since 2000.
Within agriculture, interesting changes of trends for arable land and permanent
grassland can be noted. Whereas arable land use has increased during the first periods
considered—though with a downward trend in the second period—arable land use
has considerably declined in the last period. For permanent grassland, land use has
continuously declined over the whole period, though with a less dramatic trend in
recent years. Indeed, a more detailed, yearly breakdown of the figures for permanent