

28
puted by the integration of erosion factors described in the RUSLE model. These
factors of soil erosion are described below:
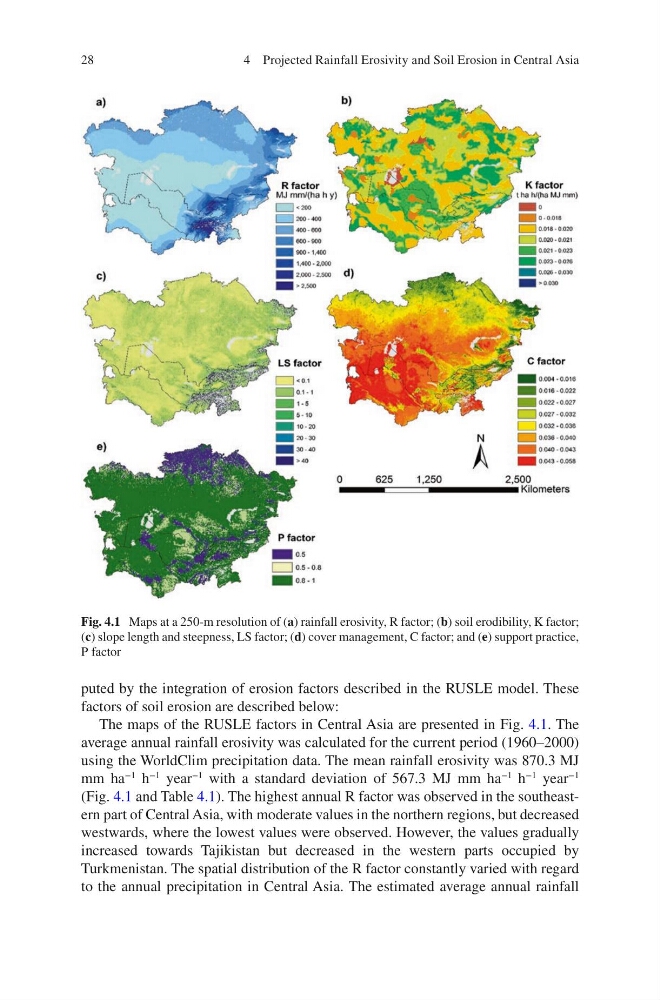
The maps of the RUSLE factors in Central Asia are presented in Fig. 4.1. The
average annual rainfall erosivity was calculated for the current period (1960–2000)
using the WorldClim precipitation data. The mean rainfall erosivity was 870.3 MJ
mm ha
−1
h
−1
year
−1
with a standard deviation of 567.3 MJ mm ha
−1
h
−1
year
−1
(Fig. 4.1 and Table 4.1). The highest annual R factor was observed in the southeastern part of Central Asia, with moderate values in the northern regions, but decreased
westwards, where the lowest values were observed. However, the values gradually
increased towards Tajikistan but decreased in the western parts occupied by
Turkmenistan. The spatial distribution of the R factor constantly varied with regard
to the annual precipitation in Central Asia. The estimated average annual rainfall
Fig. 4.1 Maps at a 250-m resolution of (a) rainfall erosivity, R factor; (b) soil erodibility, K factor;
(c) slope length and steepness, LS factor; (d) cover management, C factor; and (e) support practice,
P factor
4 Projected Rainfall Erosivity and Soil Erosion in Central Asia
puted by the integration of erosion factors described in the RUSLE model. These
factors of soil erosion are described below:
The maps of the RUSLE factors in Central Asia are presented in Fig. 4.1. The
average annual rainfall erosivity was calculated for the current period (1960–2000)
using the WorldClim precipitation data. The mean rainfall erosivity was 870.3 MJ
mm ha
−1
h
−1
year
−1
with a standard deviation of 567.3 MJ mm ha
−1
h
−1
year
−1
(Fig. 4.1 and Table 4.1). The highest annual R factor was observed in the southeastern part of Central Asia, with moderate values in the northern regions, but decreased
westwards, where the lowest values were observed. However, the values gradually
increased towards Tajikistan but decreased in the western parts occupied by
Turkmenistan. The spatial distribution of the R factor constantly varied with regard
to the annual precipitation in Central Asia. The estimated average annual rainfall
Fig. 4.1 Maps at a 250-m resolution of (a) rainfall erosivity, R factor; (b) soil erodibility, K factor;
(c) slope length and steepness, LS factor; (d) cover management, C factor; and (e) support practice,
P factor
4 Projected Rainfall Erosivity and Soil Erosion in Central Asia