

25
sgn Y Y
if Y Y
if Y Y
if Y Y
i
j
i
j
i
j
i
j
!
®
°
°
¯
°
°
1
0
0
0
1
0
(3.20)
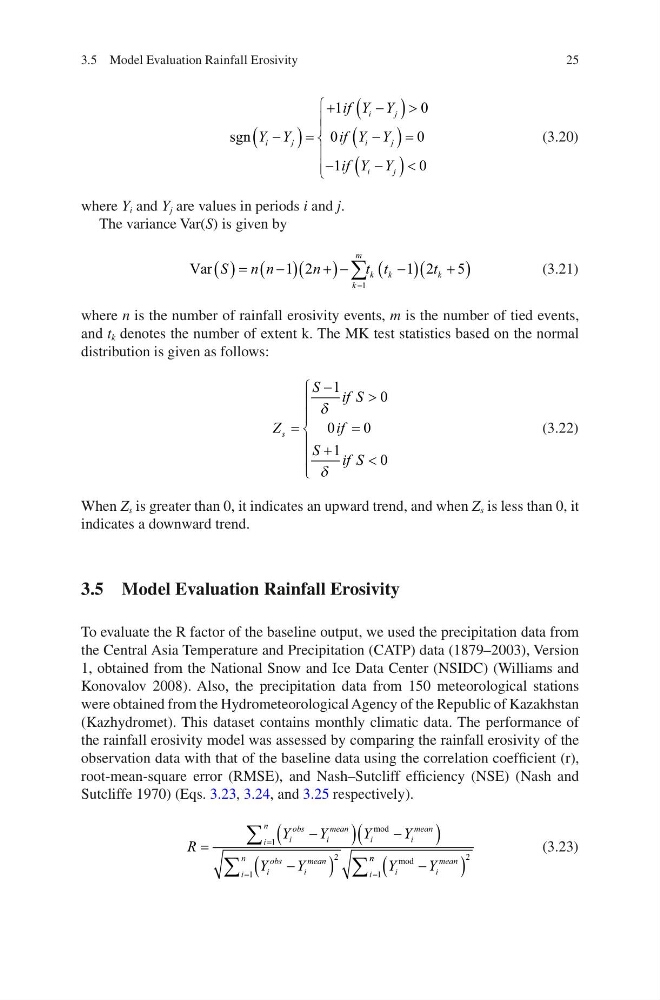
where Y i and Y j are values in periods i and j.
The variance Var(S) is given by
Var S
n n
n
t t
t
k
m
k
k
k
¦
1 2
1 2
5
1
(3.21)
where n is the number of rainfall erosivity events, m is the number of tied events,
and t k denotes the number of extent k. The MK test statistics based on the normal
distribution is given as follows:
Z
S if S
if
S if S
s
!
®
°
°
¯
°
°
1
0
0
0
1
0
G
G
(3.22)
When Z s is greater than 0, it indicates an upward trend, and when Z s is less than 0, it
indicates a downward trend.
3.5 Model Evaluation Rainfall Erosivity
To evaluate the R factor of the baseline output, we used the precipitation data from
the Central Asia Temperature and Precipitation (CATP) data (1879–2003), Version
1, obtained from the National Snow and Ice Data Center (NSIDC) (Williams and
Konovalov 2008). Also, the precipitation data from 150 meteorological stations
were obtained from the Hydrometeorological Agency of the Republic of Kazakhstan
(Kazhydromet). This dataset contains monthly climatic data. The performance of
the rainfall erosivity model was assessed by comparing the rainfall erosivity of the
observation data with that of the baseline data using the correlation coefficient (r),
root-mean-square error (RMSE), and Nash–Sutcliff efficiency (NSE) (Nash and
Sutcliffe 1970) (Eqs. 3.23, 3.24, and 3.25 respectively).
R
Y
Y
Y
Y
Y
Y
i
n
i
obs
i
mean
i
i
mean
i
n
i
obs
i
mean
i
¦
¦
1
1
2
1
mod
n n
i
i
mean
Y
Y
¦
mod
2
(3.23)
3.5 Model Evaluation Rainfall Erosivity
sgn Y Y
if Y Y
if Y Y
if Y Y
i
j
i
j
i
j
i
j
!
®
°
°
¯
°
°
1
0
0
0
1
0
(3.20)
where Y i and Y j are values in periods i and j.
The variance Var(S) is given by
Var S
n n
n
t t
t
k
m
k
k
k
¦
1 2
1 2
5
1
(3.21)
where n is the number of rainfall erosivity events, m is the number of tied events,
and t k denotes the number of extent k. The MK test statistics based on the normal
distribution is given as follows:
Z
S if S
if
S if S
s
!
®
°
°
¯
°
°
1
0
0
0
1
0
G
G
(3.22)
When Z s is greater than 0, it indicates an upward trend, and when Z s is less than 0, it
indicates a downward trend.
3.5 Model Evaluation Rainfall Erosivity
To evaluate the R factor of the baseline output, we used the precipitation data from
the Central Asia Temperature and Precipitation (CATP) data (1879–2003), Version
1, obtained from the National Snow and Ice Data Center (NSIDC) (Williams and
Konovalov 2008). Also, the precipitation data from 150 meteorological stations
were obtained from the Hydrometeorological Agency of the Republic of Kazakhstan
(Kazhydromet). This dataset contains monthly climatic data. The performance of
the rainfall erosivity model was assessed by comparing the rainfall erosivity of the
observation data with that of the baseline data using the correlation coefficient (r),
root-mean-square error (RMSE), and Nash–Sutcliff efficiency (NSE) (Nash and
Sutcliffe 1970) (Eqs. 3.23, 3.24, and 3.25 respectively).
R
Y
Y
Y
Y
Y
Y
i
n
i
obs
i
mean
i
i
mean
i
n
i
obs
i
mean
i
¦
¦
1
1
2
1
mod
n n
i
i
mean
Y
Y
¦
mod
2
(3.23)
3.5 Model Evaluation Rainfall Erosivity