

22
L
A
D
A
D
x
i j
i j in
m
i j in
m
m
i j
m
m
,
,
,
.
.
2
1
1
2
22 13
(3.11)
where L i, j is the slope length factor from the grid cell with coordinates (i, j), A i, j − in
is the contributing area at the inlet of the grid cell measured in m
2
, D is the grid cell
size, in m, x i, j = (sinα i, j + cos α i, j ), α i, j is the aspect direction for the grid cell with
coordinates (i, j), and m is related to the ratio β of the rill to interill erosion:
m
E
E
1
(3.12)
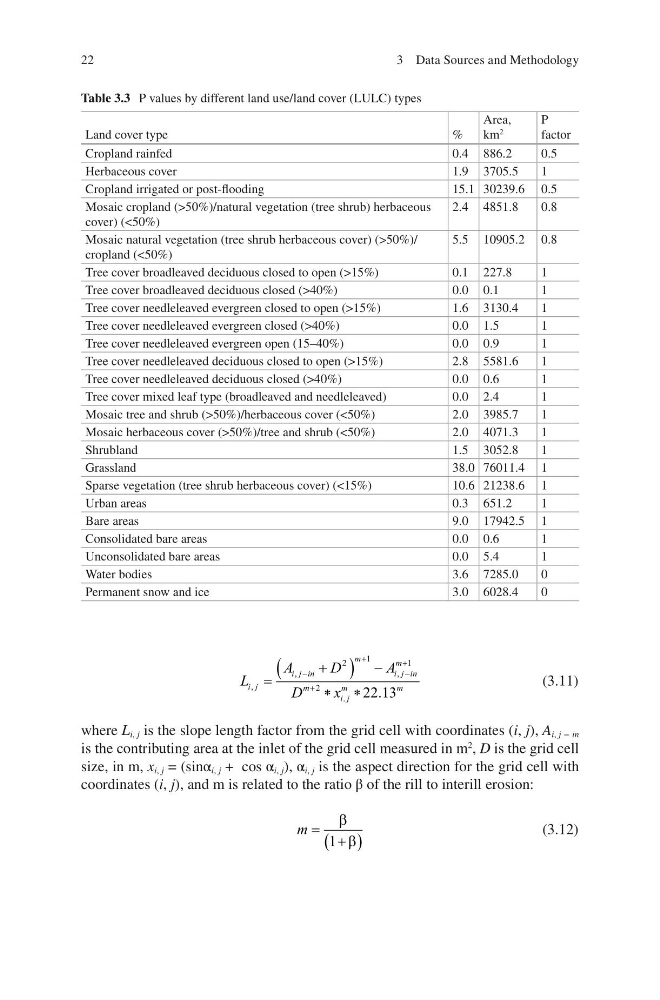
Table 3.3 P values by different land use/land cover (LULC) types
Land cover type
%
Area,
km
2
P
factor
Cropland rainfed
0.4 886.2
0.5
Herbaceous cover
1.9 3705.5
1
Cropland irrigated or post-flooding
15.1 30239.6 0.5
Mosaic cropland (>50%)/natural vegetation (tree shrub) herbaceous
cover) (<50%)
2.4 4851.8
0.8
Mosaic natural vegetation (tree shrub herbaceous cover) (>50%)/
cropland (<50%)
5.5 10905.2 0.8
Tree cover broadleaved deciduous closed to open (>15%)
0.1 227.8
1
Tree cover broadleaved deciduous closed (>40%)
0.0 0.1
1
Tree cover needleleaved evergreen closed to open (>15%)
1.6 3130.4
1
Tree cover needleleaved evergreen closed (>40%)
0.0 1.5
1
Tree cover needleleaved evergreen open (15–40%)
0.0 0.9
1
Tree cover needleleaved deciduous closed to open (>15%)
2.8 5581.6
1
Tree cover needleleaved deciduous closed (>40%)
0.0 0.6
1
Tree cover mixed leaf type (broadleaved and needleleaved)
0.0 2.4
1
Mosaic tree and shrub (>50%)/herbaceous cover (<50%)
2.0 3985.7
1
Mosaic herbaceous cover (>50%)/tree and shrub (<50%)
2.0 4071.3
1
Shrubland
1.5 3052.8
1
Grassland
38.0 76011.4 1
Sparse vegetation (tree shrub herbaceous cover) (<15%)
10.6 21238.6 1
Urban areas
0.3 651.2
1
Bare areas
9.0 17942.5 1
Consolidated bare areas
0.0 0.6
1
Unconsolidated bare areas
0.0 5.4
1
Water bodies
3.6 7285.0
0
Permanent snow and ice
3.0 6028.4
0
3 Data Sources and Methodology
L
A
D
A
D
x
i j
i j in
m
i j in
m
m
i j
m
m
,
,
,
.
.
2
1
1
2
22 13
(3.11)
where L i, j is the slope length factor from the grid cell with coordinates (i, j), A i, j − in
is the contributing area at the inlet of the grid cell measured in m
2
, D is the grid cell
size, in m, x i, j = (sinα i, j + cos α i, j ), α i, j is the aspect direction for the grid cell with
coordinates (i, j), and m is related to the ratio β of the rill to interill erosion:
m
E
E
1
(3.12)
Table 3.3 P values by different land use/land cover (LULC) types
Land cover type
%
Area,
km
2
P
factor
Cropland rainfed
0.4 886.2
0.5
Herbaceous cover
1.9 3705.5
1
Cropland irrigated or post-flooding
15.1 30239.6 0.5
Mosaic cropland (>50%)/natural vegetation (tree shrub) herbaceous
cover) (<50%)
2.4 4851.8
0.8
Mosaic natural vegetation (tree shrub herbaceous cover) (>50%)/
cropland (<50%)
5.5 10905.2 0.8
Tree cover broadleaved deciduous closed to open (>15%)
0.1 227.8
1
Tree cover broadleaved deciduous closed (>40%)
0.0 0.1
1
Tree cover needleleaved evergreen closed to open (>15%)
1.6 3130.4
1
Tree cover needleleaved evergreen closed (>40%)
0.0 1.5
1
Tree cover needleleaved evergreen open (15–40%)
0.0 0.9
1
Tree cover needleleaved deciduous closed to open (>15%)
2.8 5581.6
1
Tree cover needleleaved deciduous closed (>40%)
0.0 0.6
1
Tree cover mixed leaf type (broadleaved and needleleaved)
0.0 2.4
1
Mosaic tree and shrub (>50%)/herbaceous cover (<50%)
2.0 3985.7
1
Mosaic herbaceous cover (>50%)/tree and shrub (<50%)
2.0 4071.3
1
Shrubland
1.5 3052.8
1
Grassland
38.0 76011.4 1
Sparse vegetation (tree shrub herbaceous cover) (<15%)
10.6 21238.6 1
Urban areas
0.3 651.2
1
Bare areas
9.0 17942.5 1
Consolidated bare areas
0.0 0.6
1
Unconsolidated bare areas
0.0 5.4
1
Water bodies
3.6 7285.0
0
Permanent snow and ice
3.0 6028.4
0
3 Data Sources and Methodology