

3 Increasing Trends in Tropical Cyclone Induced Surge Impacts ...
47
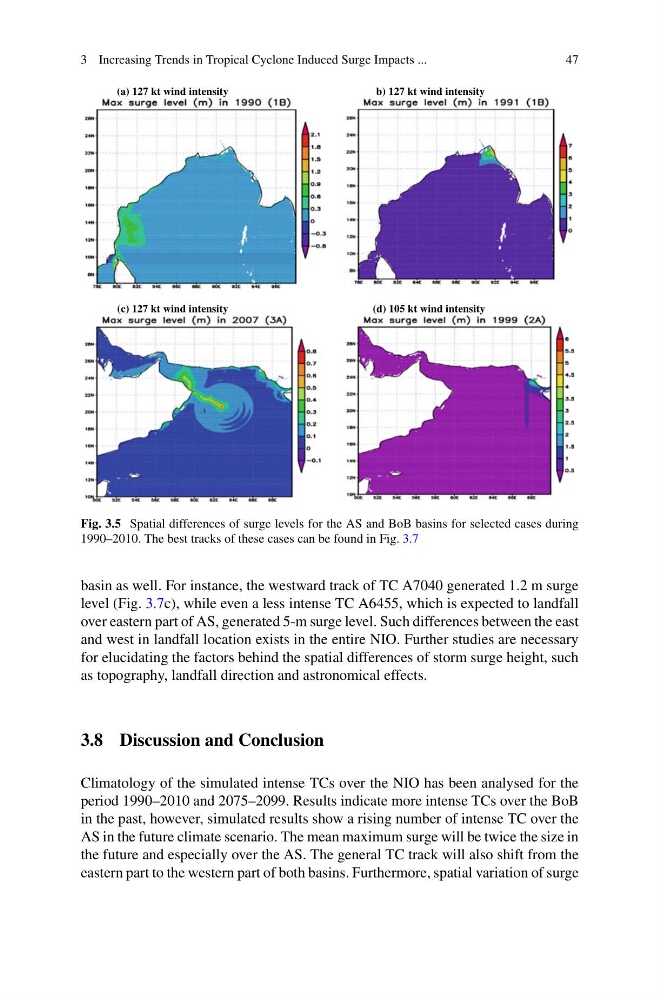
(a) 127 kt wind intensity
b) 127 kt wind intensity
(c) 127 kt wind intensity
(d) 105 kt wind intensity
Fig. 3.5 Spatial differences of surge levels for the AS and BoB basins for selected cases during
1990–2010. The best tracks of these cases can be found in Fig. 3.7
basin as well. For instance, the westward track of TC A7040 generated 1.2 m surge
level (Fig. 3.7c), while even a less intense TC A6455, which is expected to landfall
over eastern part of AS, generated 5-m surge level. Such differences between the east
and west in landfall location exists in the entire NIO. Further studies are necessary
for elucidating the factors behind the spatial differences of storm surge height, such
as topography, landfall direction and astronomical effects.
3.8 Discussion and Conclusion
Climatology of the simulated intense TCs over the NIO has been analysed for the
period 1990–2010 and 2075–2099. Results indicate more intense TCs over the BoB
in the past, however, simulated results show a rising number of intense TC over the
AS in the future climate scenario. The mean maximum surge will be twice the size in
the future and especially over the AS. The general TC track will also shift from the
eastern part to the western part of both basins. Furthermore, spatial variation of surge
47
(a) 127 kt wind intensity
b) 127 kt wind intensity
(c) 127 kt wind intensity
(d) 105 kt wind intensity
Fig. 3.5 Spatial differences of surge levels for the AS and BoB basins for selected cases during
1990–2010. The best tracks of these cases can be found in Fig. 3.7
basin as well. For instance, the westward track of TC A7040 generated 1.2 m surge
level (Fig. 3.7c), while even a less intense TC A6455, which is expected to landfall
over eastern part of AS, generated 5-m surge level. Such differences between the east
and west in landfall location exists in the entire NIO. Further studies are necessary
for elucidating the factors behind the spatial differences of storm surge height, such
as topography, landfall direction and astronomical effects.
3.8 Discussion and Conclusion
Climatology of the simulated intense TCs over the NIO has been analysed for the
period 1990–2010 and 2075–2099. Results indicate more intense TCs over the BoB
in the past, however, simulated results show a rising number of intense TC over the
AS in the future climate scenario. The mean maximum surge will be twice the size in
the future and especially over the AS. The general TC track will also shift from the
eastern part to the western part of both basins. Furthermore, spatial variation of surge