

40
Md. A. Sattar and K. K. W. Cheung
3.2.1.2 Simulated Data
In this study, future projection of TC genesis and track in the NIO are considered.
These projection data were provided by Murakami et al. (2017), in which the authors
simulated both the past (1970–2010) and future (2075–2099) period. In an earlier
study, Murakami et al. (2013) generated TC formation scenarios under the International Panel on Climate Change (IPCC) A1B scenario and fifteen ensemble experiments were performed using the JMA-MRI general circulation model (GCM). It
was reported that the ensemble mean simulated reasonable TC frequency for the
NIO basin in comparison to the observed TC frequency. Furthermore, this study
projected a significant increase of TC frequency (46%) for AS, but a substantial
decrease of TC frequency (31%) for the BoB basin. Murakami et al. (2017) came
to a similar conclusion based on the US Geophysical Fluid Dynamics Laboratory
model.
3.3 The JMA-MRI Storm Surge Model
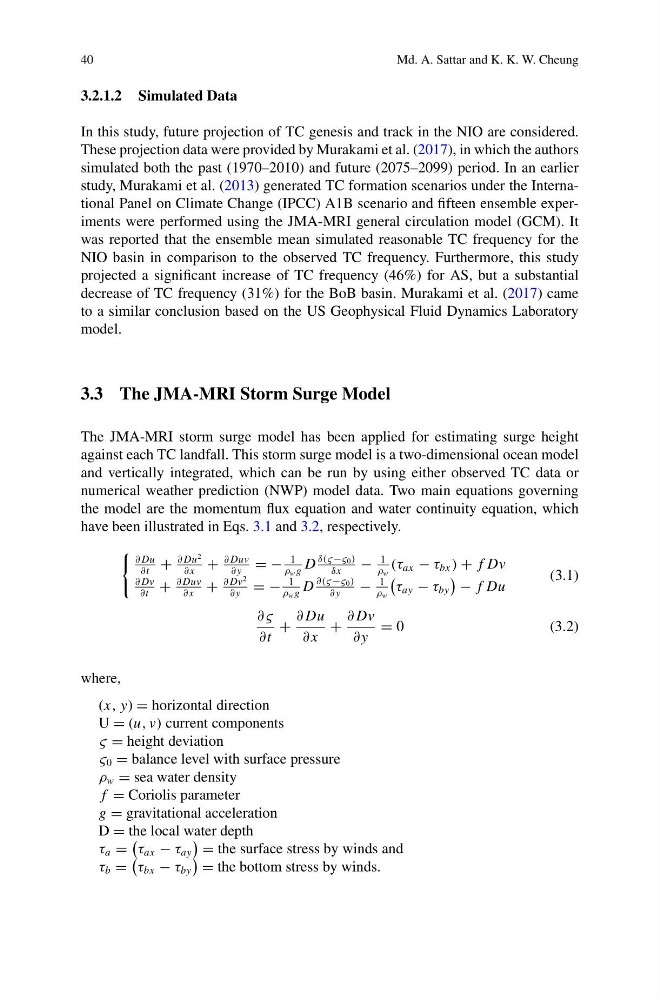
The JMA-MRI storm surge model has been applied for estimating surge height
against each TC landfall. This storm surge model is a two-dimensional ocean model
and vertically integrated, which can be run by using either observed TC data or
numerical weather prediction (NWP) model data. Two main equations governing
the model are the momentum flux equation and water continuity equation, which
have been illustrated in Eqs. 3.1 and 3.2, respectively.
∂ Du
∂t
+
∂ Du
2
∂ x
+
∂ Duv
∂ y
= −
1
ρ w g
D
δ(ς−ς 0 )
δx
−
1
ρ w
(τ ax − τ bx ) + f Dv
∂ Dv
∂t
+
∂ Duv
∂ x
+
∂ Dv
2
∂ y
= −
1
ρ w g
D
∂(ς−ς 0 )
∂ y
−
1
ρ w
τ ay − τ by
− f Du
(3.1)
∂ς
∂t
+
∂ Du
∂ x
+
∂ Dv
∂ y
= 0
( 3 . 2 )
where,
(x, y) = horizontal direction
U = (u, v) current components
ς = height deviation
ς 0 = balance level with surface pressure
ρ w = sea water density
f = Coriolis parameter
g = gravitational acceleration
D = the local water depth
τ a =
τ ax − τ ay
= the surface stress by winds and
τ b =
τ bx − τ by
= the bottom stress by winds.
Md. A. Sattar and K. K. W. Cheung
3.2.1.2 Simulated Data
In this study, future projection of TC genesis and track in the NIO are considered.
These projection data were provided by Murakami et al. (2017), in which the authors
simulated both the past (1970–2010) and future (2075–2099) period. In an earlier
study, Murakami et al. (2013) generated TC formation scenarios under the International Panel on Climate Change (IPCC) A1B scenario and fifteen ensemble experiments were performed using the JMA-MRI general circulation model (GCM). It
was reported that the ensemble mean simulated reasonable TC frequency for the
NIO basin in comparison to the observed TC frequency. Furthermore, this study
projected a significant increase of TC frequency (46%) for AS, but a substantial
decrease of TC frequency (31%) for the BoB basin. Murakami et al. (2017) came
to a similar conclusion based on the US Geophysical Fluid Dynamics Laboratory
model.
3.3 The JMA-MRI Storm Surge Model
The JMA-MRI storm surge model has been applied for estimating surge height
against each TC landfall. This storm surge model is a two-dimensional ocean model
and vertically integrated, which can be run by using either observed TC data or
numerical weather prediction (NWP) model data. Two main equations governing
the model are the momentum flux equation and water continuity equation, which
have been illustrated in Eqs. 3.1 and 3.2, respectively.
∂ Du
∂t
+
∂ Du
2
∂ x
+
∂ Duv
∂ y
= −
1
ρ w g
D
δ(ς−ς 0 )
δx
−
1
ρ w
(τ ax − τ bx ) + f Dv
∂ Dv
∂t
+
∂ Duv
∂ x
+
∂ Dv
2
∂ y
= −
1
ρ w g
D
∂(ς−ς 0 )
∂ y
−
1
ρ w
τ ay − τ by
− f Du
(3.1)
∂ς
∂t
+
∂ Du
∂ x
+
∂ Dv
∂ y
= 0
( 3 . 2 )
where,
(x, y) = horizontal direction
U = (u, v) current components
ς = height deviation
ς 0 = balance level with surface pressure
ρ w = sea water density
f = Coriolis parameter
g = gravitational acceleration
D = the local water depth
τ a =
τ ax − τ ay
= the surface stress by winds and
τ b =
τ bx − τ by
= the bottom stress by winds.