

28
P. Muñoz et al.
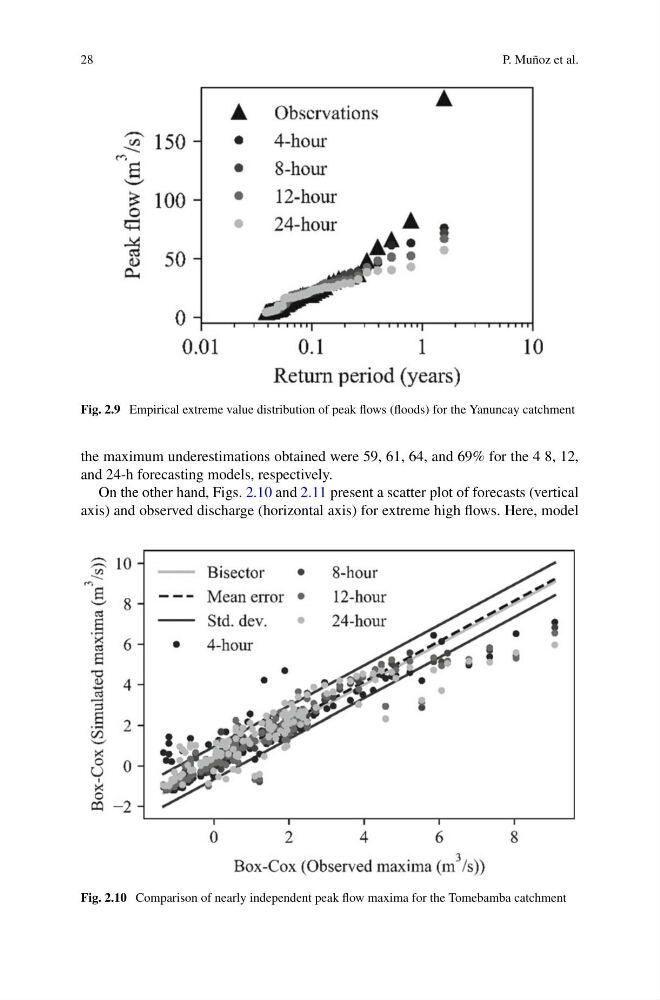
Fig. 2.9 Empirical extreme value distribution of peak flows (floods) for the Yanuncay catchment
the maximum underestimations obtained were 59, 61, 64, and 69% for the 4 8, 12,
and 24-h forecasting models, respectively.
On the other hand, Figs. 2.10 and 2.11 present a scatter plot of forecasts (vertical
axis) and observed discharge (horizontal axis) for extreme high flows. Here, model
Fig. 2.10 Comparison of nearly independent peak flow maxima for the Tomebamba catchment
P. Muñoz et al.
Fig. 2.9 Empirical extreme value distribution of peak flows (floods) for the Yanuncay catchment
the maximum underestimations obtained were 59, 61, 64, and 69% for the 4 8, 12,
and 24-h forecasting models, respectively.
On the other hand, Figs. 2.10 and 2.11 present a scatter plot of forecasts (vertical
axis) and observed discharge (horizontal axis) for extreme high flows. Here, model
Fig. 2.10 Comparison of nearly independent peak flow maxima for the Tomebamba catchment