

9 Understanding Social-Mediated Disaster …
167
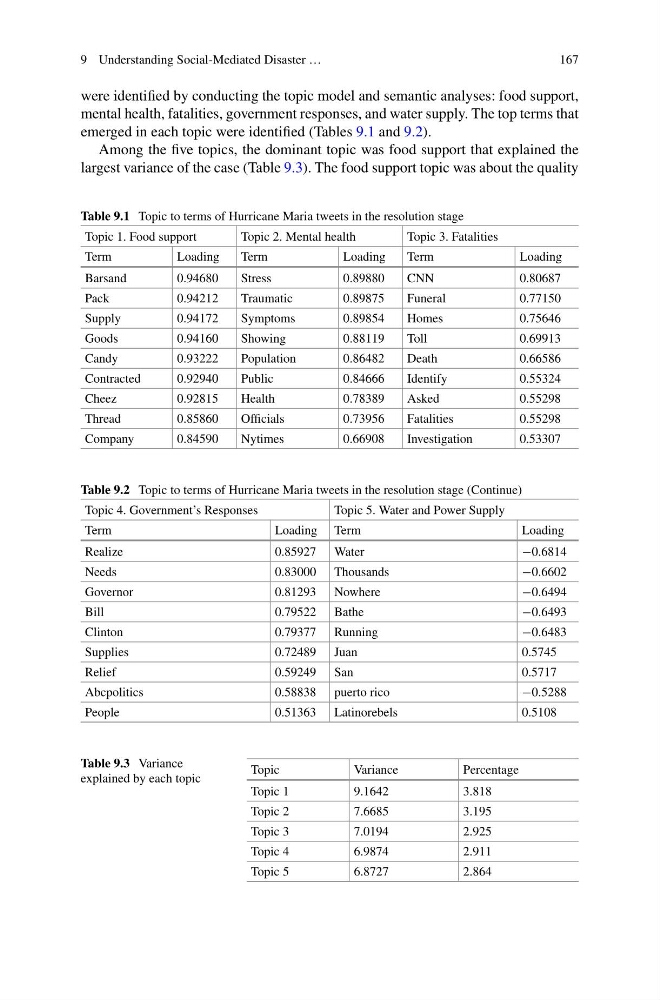
were identified by conducting the topic model and semantic analyses: food support,
mental health, fatalities, government responses, and water supply. The top terms that
emerged in each topic were identified (Tables 9.1 and 9.2).
Among the five topics, the dominant topic was food support that explained the
largest variance of the case (Table 9.3). The food support topic was about the quality
Table 9.1 Topic to terms of Hurricane Maria tweets in the resolution stage
Topic 1. Food support
Topic 2. Mental health
Topic 3. Fatalities
Term
Loading
Term
Loading
Term
Loading
Barsand
0.94680
Stress
0.89880
CNN
0.80687
Pack
0.94212
Traumatic
0.89875
Funeral
0.77150
Supply
0.94172
Symptoms
0.89854
Homes
0.75646
Goods
0.94160
Showing
0.88119
Toll
0.69913
Candy
0.93222
Population
0.86482
Death
0.66586
Contracted
0.92940
Public
0.84666
Identify
0.55324
Cheez
0.92815
Health
0.78389
Asked
0.55298
Thread
0.85860
Officials
0.73956
Fatalities
0.55298
Company
0.84590
Nytimes
0.66908
Investigation
0.53307
Table 9.2 Topic to terms of Hurricane Maria tweets in the resolution stage (Continue)
Topic 4. Government’s Responses
Topic 5. Water and Power Supply
Term
Loading Term
Loading
Realize
0.85927 Water
−0.6814
Needs
0.83000 Thousands
−0.6602
Governor
0.81293 Nowhere
−0.6494
Bill
0.79522 Bathe
−0.6493
Clinton
0.79377 Running
−0.6483
Supplies
0.72489 Juan
0.5745
Relief
0.59249 San
0.5717
Abcpolitics
0.58838 puerto rico
−0.5288
People
0.51363 Latinorebels
0.5108
Table 9.3 Variance
explained by each topic
Topic
Variance
Percentage
Topic 1
9.1642
3.818
Topic 2
7.6685
3.195
Topic 3
7.0194
2.925
Topic 4
6.9874
2.911
Topic 5
6.8727
2.864
167
were identified by conducting the topic model and semantic analyses: food support,
mental health, fatalities, government responses, and water supply. The top terms that
emerged in each topic were identified (Tables 9.1 and 9.2).
Among the five topics, the dominant topic was food support that explained the
largest variance of the case (Table 9.3). The food support topic was about the quality
Table 9.1 Topic to terms of Hurricane Maria tweets in the resolution stage
Topic 1. Food support
Topic 2. Mental health
Topic 3. Fatalities
Term
Loading
Term
Loading
Term
Loading
Barsand
0.94680
Stress
0.89880
CNN
0.80687
Pack
0.94212
Traumatic
0.89875
Funeral
0.77150
Supply
0.94172
Symptoms
0.89854
Homes
0.75646
Goods
0.94160
Showing
0.88119
Toll
0.69913
Candy
0.93222
Population
0.86482
Death
0.66586
Contracted
0.92940
Public
0.84666
Identify
0.55324
Cheez
0.92815
Health
0.78389
Asked
0.55298
Thread
0.85860
Officials
0.73956
Fatalities
0.55298
Company
0.84590
Nytimes
0.66908
Investigation
0.53307
Table 9.2 Topic to terms of Hurricane Maria tweets in the resolution stage (Continue)
Topic 4. Government’s Responses
Topic 5. Water and Power Supply
Term
Loading Term
Loading
Realize
0.85927 Water
−0.6814
Needs
0.83000 Thousands
−0.6602
Governor
0.81293 Nowhere
−0.6494
Bill
0.79522 Bathe
−0.6493
Clinton
0.79377 Running
−0.6483
Supplies
0.72489 Juan
0.5745
Relief
0.59249 San
0.5717
Abcpolitics
0.58838 puerto rico
−0.5288
People
0.51363 Latinorebels
0.5108
Table 9.3 Variance
explained by each topic
Topic
Variance
Percentage
Topic 1
9.1642
3.818
Topic 2
7.6685
3.195
Topic 3
7.0194
2.925
Topic 4
6.9874
2.911
Topic 5
6.8727
2.864