

96
M. D. Setiawati et al.
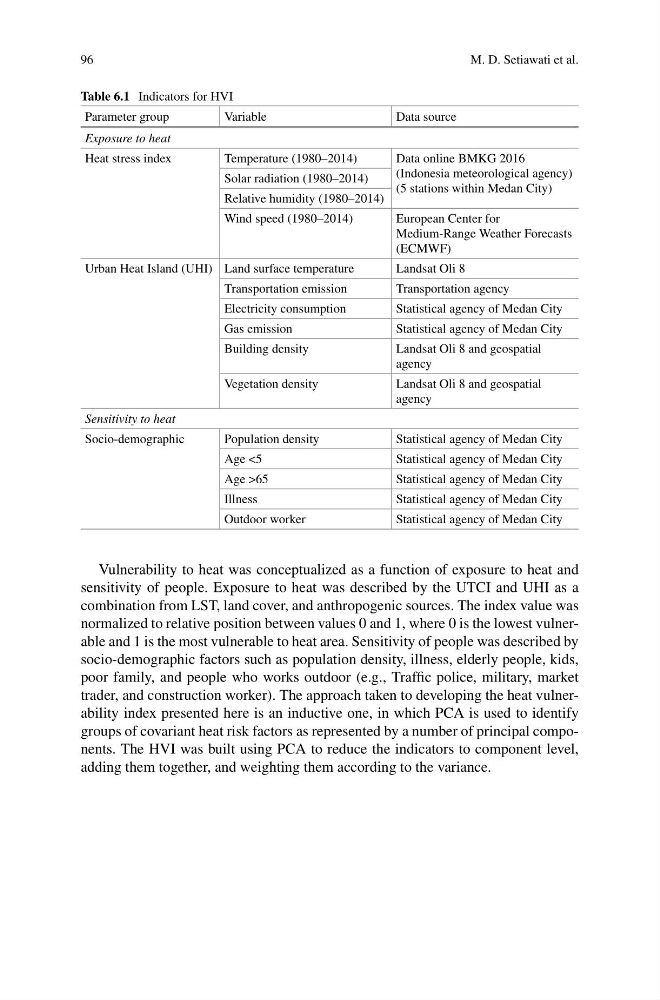
Table 6.1 Indicators for HVI
Parameter group
Variable
Data source
Exposure to heat
Heat stress index
Temperature (1980–2014)
Data online BMKG 2016
(Indonesia meteorological agency)
(5 stations within Medan City)
Solar radiation (1980–2014)
Relative humidity (1980–2014)
Wind speed (1980–2014)
European Center for
Medium-Range Weather Forecasts
(ECMWF)
Urban Heat Island (UHI) Land surface temperature
Landsat Oli 8
Transportation emission
Transportation agency
Electricity consumption
Statistical agency of Medan City
Gas emission
Statistical agency of Medan City
Building density
Landsat Oli 8 and geospatial
agency
Vegetation density
Landsat Oli 8 and geospatial
agency
Sensitivity to heat
Socio-demographic
Population density
Statistical agency of Medan City
Age <5
Statistical agency of Medan City
Age >65
Statistical agency of Medan City
Illness
Statistical agency of Medan City
Outdoor worker
Statistical agency of Medan City
Vulnerability to heat was conceptualized as a function of exposure to heat and
sensitivity of people. Exposure to heat was described by the UTCI and UHI as a
combination from LST, land cover, and anthropogenic sources. The index value was
normalized to relative position between values 0 and 1, where 0 is the lowest vulnerable and 1 is the most vulnerable to heat area. Sensitivity of people was described by
socio-demographic factors such as population density, illness, elderly people, kids,
poor family, and people who works outdoor (e.g., Traffic police, military, market
trader, and construction worker). The approach taken to developing the heat vulnerability index presented here is an inductive one, in which PCA is used to identify
groups of covariant heat risk factors as represented by a number of principal components. The HVI was built using PCA to reduce the indicators to component level,
adding them together, and weighting them according to the variance.
M. D. Setiawati et al.
Table 6.1 Indicators for HVI
Parameter group
Variable
Data source
Exposure to heat
Heat stress index
Temperature (1980–2014)
Data online BMKG 2016
(Indonesia meteorological agency)
(5 stations within Medan City)
Solar radiation (1980–2014)
Relative humidity (1980–2014)
Wind speed (1980–2014)
European Center for
Medium-Range Weather Forecasts
(ECMWF)
Urban Heat Island (UHI) Land surface temperature
Landsat Oli 8
Transportation emission
Transportation agency
Electricity consumption
Statistical agency of Medan City
Gas emission
Statistical agency of Medan City
Building density
Landsat Oli 8 and geospatial
agency
Vegetation density
Landsat Oli 8 and geospatial
agency
Sensitivity to heat
Socio-demographic
Population density
Statistical agency of Medan City
Age <5
Statistical agency of Medan City
Age >65
Statistical agency of Medan City
Illness
Statistical agency of Medan City
Outdoor worker
Statistical agency of Medan City
Vulnerability to heat was conceptualized as a function of exposure to heat and
sensitivity of people. Exposure to heat was described by the UTCI and UHI as a
combination from LST, land cover, and anthropogenic sources. The index value was
normalized to relative position between values 0 and 1, where 0 is the lowest vulnerable and 1 is the most vulnerable to heat area. Sensitivity of people was described by
socio-demographic factors such as population density, illness, elderly people, kids,
poor family, and people who works outdoor (e.g., Traffic police, military, market
trader, and construction worker). The approach taken to developing the heat vulnerability index presented here is an inductive one, in which PCA is used to identify
groups of covariant heat risk factors as represented by a number of principal components. The HVI was built using PCA to reduce the indicators to component level,
adding them together, and weighting them according to the variance.