

Costa Rica was recently awarded as the United Nations Champion of the Earth for
2019. According to Delahaye (2019), in the policy leadership category especially,
Costa Rica was recognised for its role in nature protection and fighting against
climate change. The country is aiming to decarbonise, achieving net zero carbon
emissions, by 2050 in accordance with the Paris Climate Agreement and the United
Nations Sustainable Development Goals. To achieve this ambition, the country will
not produce more emissions than can be offset through actions such as maintaining
and expanding its forests. It already produces low emissions (0.4% of world emissions), but Costa Rica seeks to wholly produce renewable energy by 2030, when
electric buses and taxis will be deployed. In 2017, also according to Delahaye
(2019), the country ran on renewable energy for a record of 300 days; and 95% of
its energy is already renewable. Costa Rica has counteracted deforestation since
1987 and has since become half-forested, which augments its biocapacity in order to
offset emissions.
According to the National Footprint Accounts (Global Footprint Network 2020),
in 2016 Costa Rica had an annual per person GDP of $9592 per person; with a total
population of 4,857,274 people. Its biocapacity per person was 1.6 global hectares
and its Ecological Footprint 2.7 global hectares per person (see Table 3.1),
establishing a net deficit of À1.1 global hectares per person (based on the difference
between the EF and BC, according to the Global Footprint Network 2020 – using
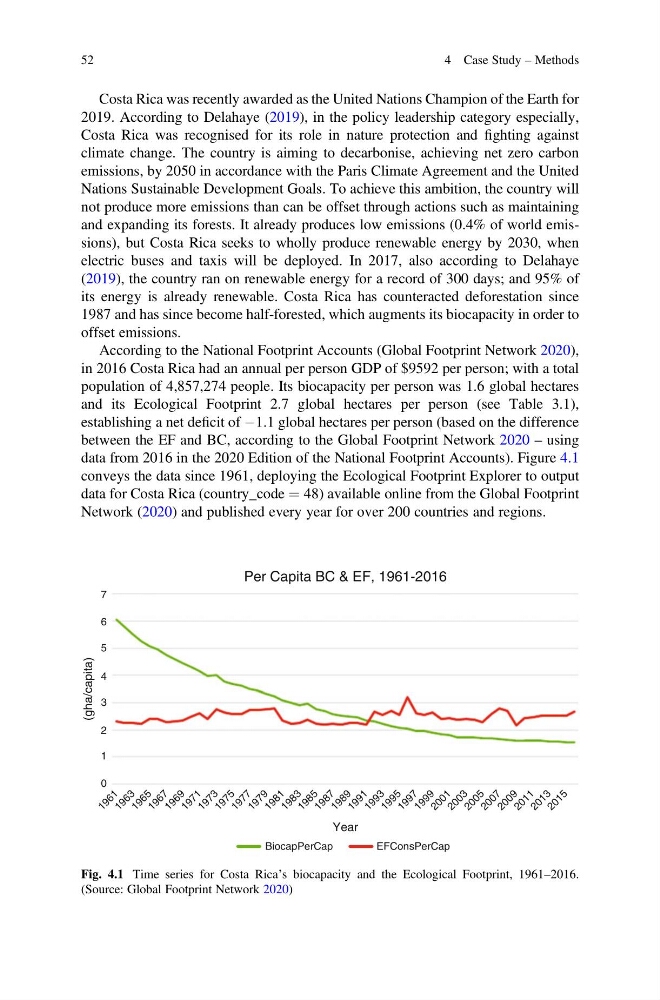
data from 2016 in the 2020 Edition of the National Footprint Accounts). Figure 4.1
conveys the data since 1961, deploying the Ecological Footprint Explorer to output
data for Costa Rica (country_code ¼ 48) available online from the Global Footprint
Network (2020) and published every year for over 200 countries and regions.
7
6
5
4
3
2
(gha/capita)
1
0
Year
1 9 6 1
1 9 6 3
1 9 6 5
1 9 6 7
1 9 6 9
1 9 7 1
1 9 7 3
1 9 7 5
1 9 7 7
1 9 7 9
1 9 8 1
1 9 8 3
1 9 8 5
1 9 8 7
1 9 8 9
1 9 9 1
1 9 9 3
1 9 9 5
1 9 9 7
1 9 9 9
2 0 0 1
2 0 0 3
2 0 0 5
2 0 0 7
2 0 0 9
2 0 1 1
2 0 1 3
2 0 1 5
Per Capita BC & EF, 1961-2016
BiocapPerCap
EFConsPerCap
Fig. 4.1 Time series for Costa Rica’s biocapacity and the Ecological Footprint, 1961–2016.
(Source: Global Footprint Network 2020)
52
4 Case Study – Methods
2019. According to Delahaye (2019), in the policy leadership category especially,
Costa Rica was recognised for its role in nature protection and fighting against
climate change. The country is aiming to decarbonise, achieving net zero carbon
emissions, by 2050 in accordance with the Paris Climate Agreement and the United
Nations Sustainable Development Goals. To achieve this ambition, the country will
not produce more emissions than can be offset through actions such as maintaining
and expanding its forests. It already produces low emissions (0.4% of world emissions), but Costa Rica seeks to wholly produce renewable energy by 2030, when
electric buses and taxis will be deployed. In 2017, also according to Delahaye
(2019), the country ran on renewable energy for a record of 300 days; and 95% of
its energy is already renewable. Costa Rica has counteracted deforestation since
1987 and has since become half-forested, which augments its biocapacity in order to
offset emissions.
According to the National Footprint Accounts (Global Footprint Network 2020),
in 2016 Costa Rica had an annual per person GDP of $9592 per person; with a total
population of 4,857,274 people. Its biocapacity per person was 1.6 global hectares
and its Ecological Footprint 2.7 global hectares per person (see Table 3.1),
establishing a net deficit of À1.1 global hectares per person (based on the difference
between the EF and BC, according to the Global Footprint Network 2020 – using
data from 2016 in the 2020 Edition of the National Footprint Accounts). Figure 4.1
conveys the data since 1961, deploying the Ecological Footprint Explorer to output
data for Costa Rica (country_code ¼ 48) available online from the Global Footprint
Network (2020) and published every year for over 200 countries and regions.
7
6
5
4
3
2
(gha/capita)
1
0
Year
1 9 6 1
1 9 6 3
1 9 6 5
1 9 6 7
1 9 6 9
1 9 7 1
1 9 7 3
1 9 7 5
1 9 7 7
1 9 7 9
1 9 8 1
1 9 8 3
1 9 8 5
1 9 8 7
1 9 8 9
1 9 9 1
1 9 9 3
1 9 9 5
1 9 9 7
1 9 9 9
2 0 0 1
2 0 0 3
2 0 0 5
2 0 0 7
2 0 0 9
2 0 1 1
2 0 1 3
2 0 1 5
Per Capita BC & EF, 1961-2016
BiocapPerCap
EFConsPerCap
Fig. 4.1 Time series for Costa Rica’s biocapacity and the Ecological Footprint, 1961–2016.
(Source: Global Footprint Network 2020)
52
4 Case Study – Methods